MT5 (Android) Basic Chart Settings
Changing Chart Types
In the Android version of MT5, you can display bar charts, candlestick charts, and line charts. To change the chart type, tap on the chart and then tap the 'Settings' icon (resembling a gear).
From the settings screen that appears, tap on the type of chart you want to display to change the chart type.

Setting Display Items on Charts
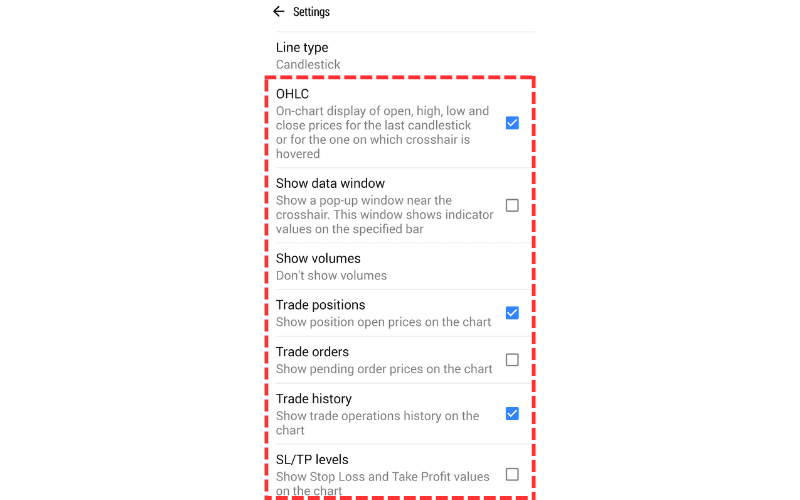
In the Android version of MT5, you can toggle the display of OHLC (open, high, low, close), data window (shows indicator values when in crosshair mode), volume (tick volume for FX and CFDs), trade levels (display levels of existing positions and pending orders), and period separators. Here’s how to do it:
Tap on the chart, then tap the 'Settings' icon (resembling a gear) from the menu that appears, and toggle the display options in the settings menu.
Zooming In and Out of Charts
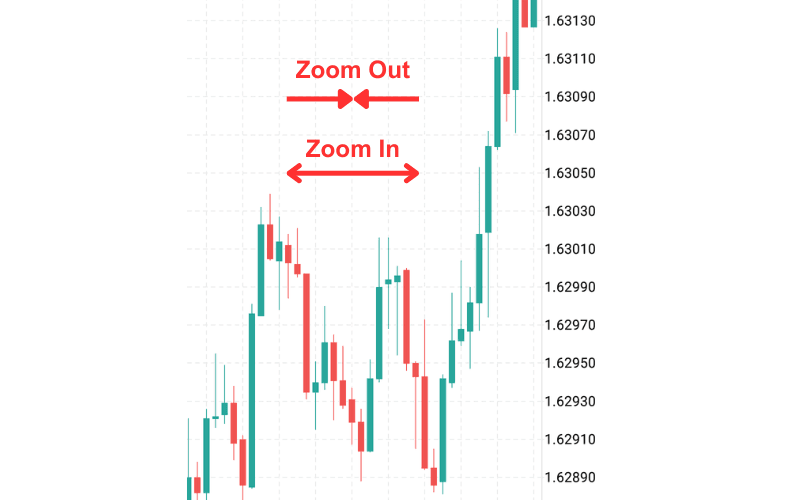
To zoom in and out on the chart, use pinch out and pinch in gestures directly on the chart.
Changing the Time Frame
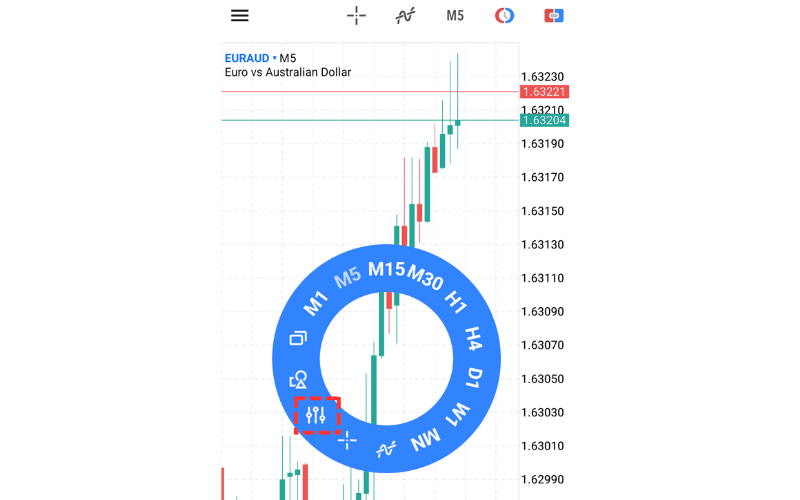
Tapping on the chart displays a donut-shaped menu; from this menu, you can select the desired time frame to switch the chart’s time frame.
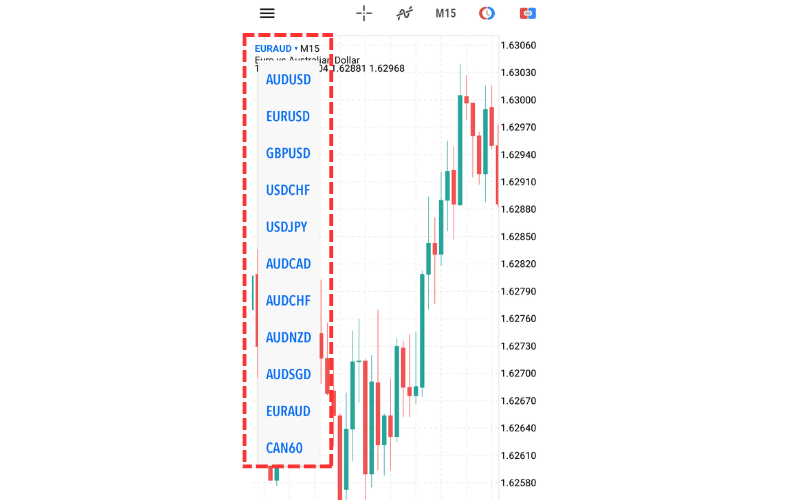
Changing the Symbol
To change the symbol, tap the '$' icon at the top of the chart. The symbols displayed here are those shown in the Market Watch. If the desired symbol is not listed, it needs to be added in the Market Watch settings.
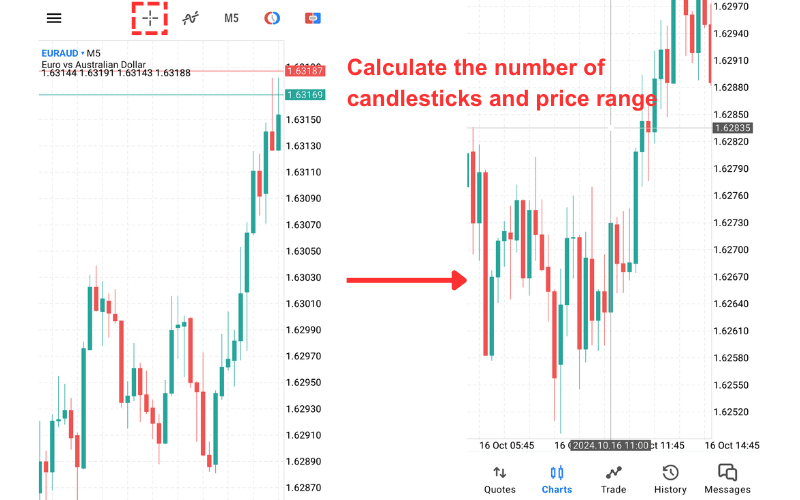
Switching to Crosshair Mode
To switch the cursor to crosshair on the chart, tap the crosshair icon at the top of the screen. The Android version's crosshair displays the price and time at the cursor's position and allows you to calculate the number of candlesticks and price range by tapping one point and then another.
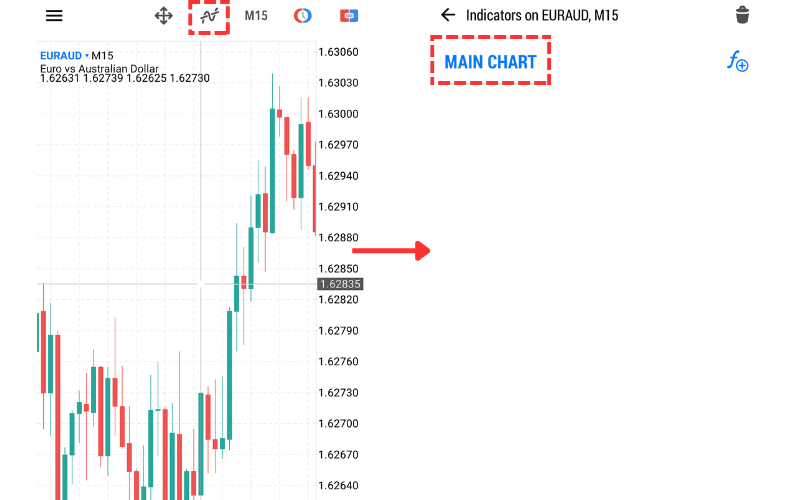
Displaying Indicators
To display indicators, tap the indicator icon (resembling an 'f') at the top of the screen, and then tap 'Main Chart' on the 'Indicator' screen.
Select the indicator you want to display from the list of indicators that appears.
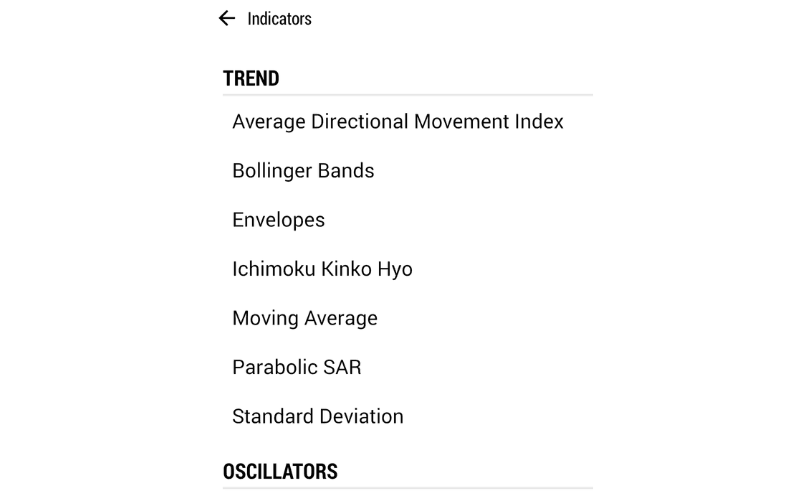
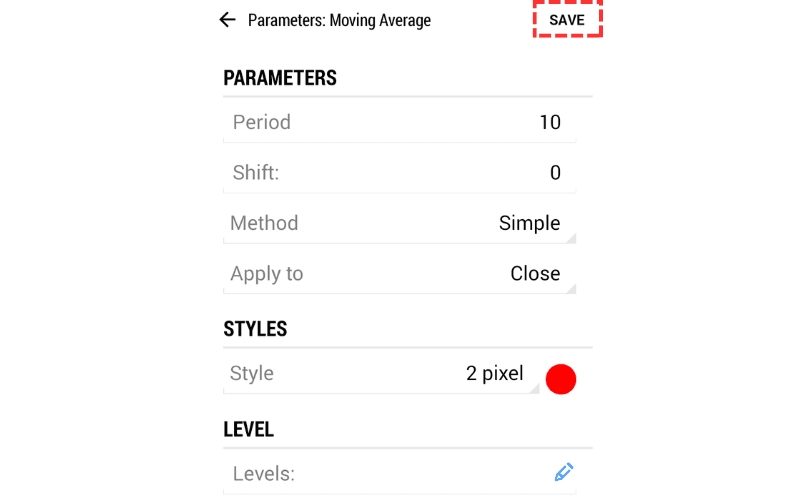
Set the parameters and tap 'Done' at the top right to display the indicator.
Deleting Indicators
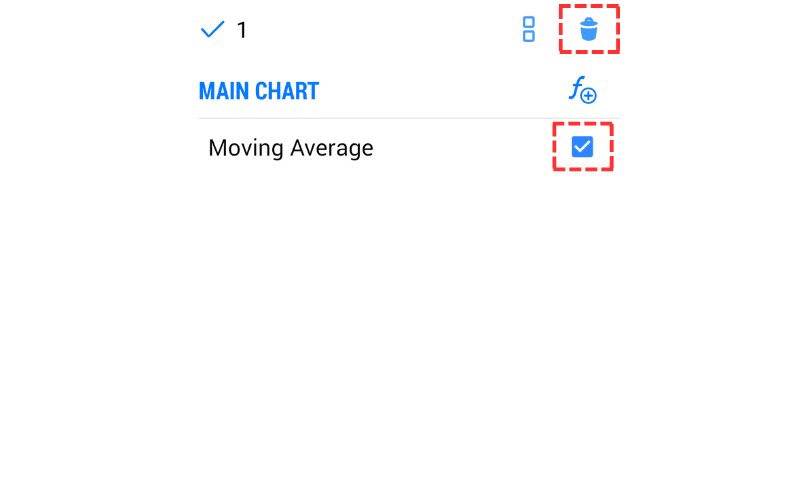
To remove an unwanted indicator, tap the indicator icon (resembling an 'f') at the top of the chart, display the list of indicators, tap the trash can icon in the top right, check the box next to the indicator you wish to delete, and tap the trash can icon again to remove the indicator.
Adding and Deleting Charts
Adding Charts
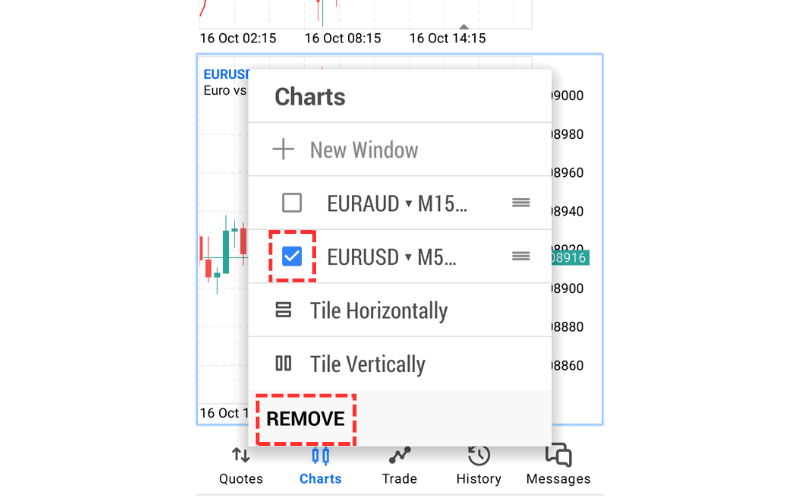
In the Android version of MT5, you can display two charts simultaneously. To add a chart, tap the chart addition icon (second icon from the right that looks like stacked squares) at the top of the chart, and select 'New Window' from the menu that appears.
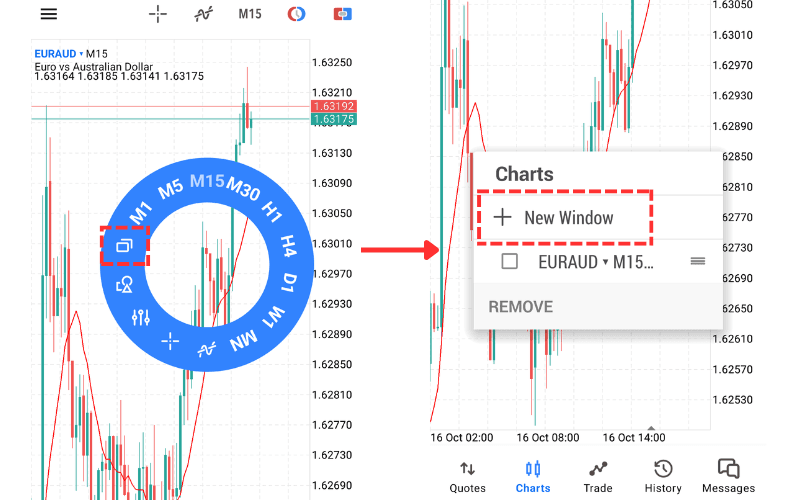
Chart Display Mode
When displaying two charts, you can choose to arrange them vertically (split horizontally) or horizontally (split vertically). To change this, select'Tile Horizontal' or 'Tile Vertically' from the menu inside the chart addition icon.

Deleting Charts
To delete a chart, tap the chart addition icon, check the chart you want to remove from the menu that appears, and tap 'REMOVE' at the bottom of the menu to remove the chart.