

Column
This column is dedicated to exploring various strategies and techniques in the field of financial investment, covering a wide range of asset classes including, but not limited to, stocks, forex, precious metals, energy, agricultural products, and cryptocu
How US Midterm Elections Affect Stocks and the Dollar: What History Shows
The US midterm elections decide control of Congress, and markets watch them for what they mean for fiscal policy and yields. This article covers what is on the ballot in 2026, how US stocks have performed in the 12 months after midterms since 1950 and the limits of that record, what US stocks and USD/JPY actually did after the 2018 and 2022 votes, and the FOMC and data dates to watch around the 2026 election.
How to Read the EA Forward Test Ranking: Profitability, Profit Factor, Win Rate and Drawdown
The EA Forward Test Ranking ranks EAs running on demo accounts by profitability, total P&L, profit factor, win rate and drawdown, but it opens on the last 30 days and mixes figures that include floating P&L with figures that do not. This article explains how each column is calculated, the two meanings of the dash in the profit factor column, which period and fields to check on the detail page, and four steps for comparing EAs.
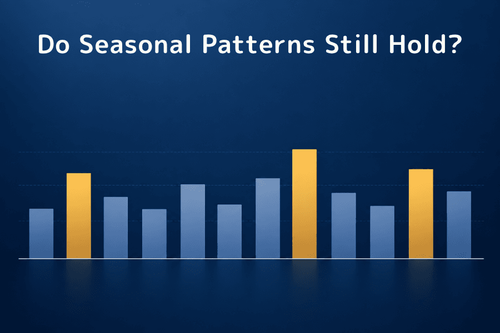
Do Seasonal Patterns Still Hold? Five Calendar Effects Against Ten Years of Data
Seasonality means that the tendency of certain months to rise or fall has repeated in the past. This article uses monthly data from 2016 to 2025 in Titan FX's Seasonality Analysis to test five familiar claims: only gold's early-year strength holds up in full, the summer and winter halves of the US500 both averaged +6.9%, and the original definitions of the January Effect and the Santa Claus Rally sit outside what monthly data can reach.
How to Read an Instrument Page: EUR/USD from Top to Bottom
Titan FX Research gives every instrument its own page, with the verdict at the top, the evidence in the middle and costs and tools at the bottom. This article walks through EUR/USD in the page's own order: how to read the 72-signal overall assessment, why a zero in the swap table does not mean a free day, why the five pivot methods return different numbers of levels, and how the micro account's contract size breaks a straight cost comparison, before combining the six blocks into one conclusion.
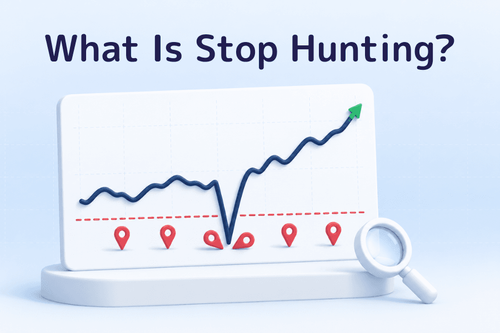
What Is Stop Hunting? Where Stops Cluster, How to Spot a Sweep, and How to Place Stops That Survive
A stop hunt is a move through a cluster of stop-loss orders that triggers them and then snaps back. This article explains why it happens, the five places where stops cluster, three signs of a sweep with a USD/JPY example, how to place a stop from the failure point with an ATR buffer and a matching lot size, how to enter after a sweep, and how to cross-check order clusters on the chart with Titan FX's Pending Orders and Open Position Trends.
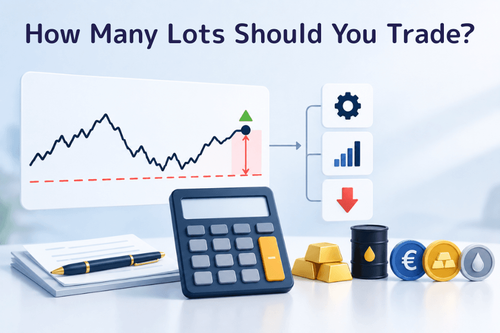
Position Sizing: How to Calculate Forex Lot Size, Pip Value and Use the Margin Calculator
Position sizing decides how many lots to trade from your account balance, the loss you accept per trade and the stop distance. This article covers the lot size formula, pip value for forex, gold, indices, crude oil and crypto, reverse-engineering lot size with the Titan FX margin calculator, three ways to set the stop distance, and total risk across several positions.
Titan FX Market Analysis Tools: Finding the Right One at Each Step of a Trade
Titan FX Research offers 30 free market analysis tools covering pre-session preparation, instrument screening, direction, cost estimates, exposure checks, and strategy testing. This guide arranges all 30 in the order of the six stages a trade actually passes through: confirming event risk before the session, finding the instruments that are moving now, reading the technical position, costing the trade and choosing the hour before entry, checking whether positions duplicate the same bet, and calibrating your overall approach with market positioning and risk of ruin. Each tool comes with a screen description, a link to the page, and a note on what it can and cannot answer.
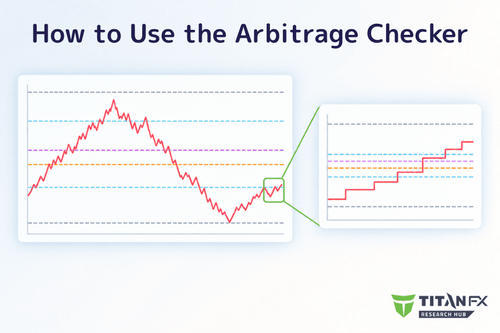
Which of Two Instruments Is Stronger? Reading Price Ratios in the Arbitrage Checker
The Arbitrage Checker divides one instrument's price by another's and plots ten years of the ratio with six statistical lines: maximum, minimum, average, median and plus or minus one standard deviation. The tool page's guide covers the four patterns and the pairs-trading workflow in detail, but two things need confirming before you rely on the chart: the quote direction of the two symbols decides what the line represents, and the six statistical lines are calculated only over the range on screen. This article covers how symbol order, four-decimal rounding and period switching change the reading, then sets out a reading order.
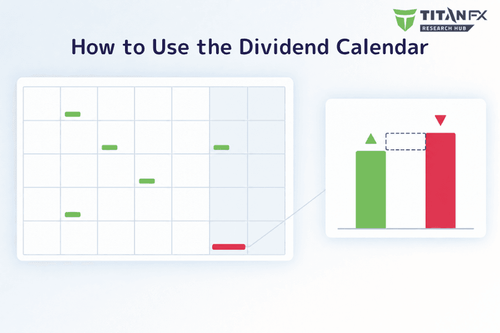
How Much Dividend Will Your Position Receive or Pay? Reading the Dividend Calendar
The Dividend Calendar lists the dividend adjustments on Titan FX index and US stock CFDs day by day: when each occurred, how much a buy position received and how much a sell position paid, in the settlement currency per unit of contract size, with a monthly totals table alongside. This article covers how to read the numbers, why the buy and sell amounts differ on US stocks, and three ways to use the tool: costing a short, reconciling an account entry and checking overnight holding costs.
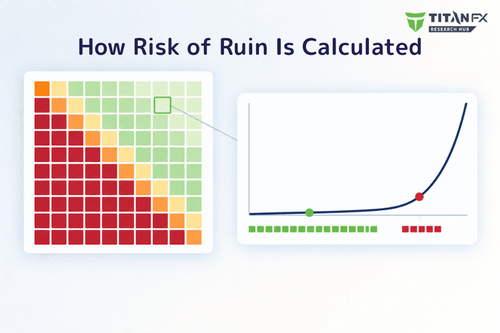
How Is Risk of Ruin Calculated? Checking Whether Your Capital Can Take It with the Simulator
The Risk of Ruin Simulator turns win rate, payoff ratio, risk per trade and a ruin line into the theoretical probability that your capital falls to that line. The tool page's guide explains the verdicts and the check routine; what needs handling first in practice is the input side. Win rate and payoff come from the statistics of an MT5 trading report, risk per trade is calculated from your stop distance, and the ruin line is your own call. This article covers where each number comes from, how the tool turns them into a probability, and what happens to one track record as the ruin line and sizing method change.
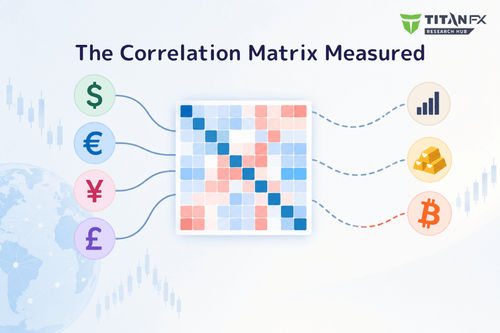
The Correlation Matrix Measured: Which Instruments Move Together, and Which Do Not Hold
The Correlation Matrix turns the co-movement of 19 major instruments into a single number for every pair, spanning FX, indices, commodities and crypto. This article reads all five period settings for all 171 pairs and compares them. Gold and silver stay above +0.83 across every period, US500 and NAS100 above +0.83, the Australian and New Zealand dollars above +0.77 — and holding any of those in the same direction at once is running the same trade twice. At the other end, 44 of the 171 pairs flip sign at least once, with the Dow against Brent crude running from +0.10 to -0.67. The article also sets out the method and its limits, and why low correlation is not a guarantee of diversification.
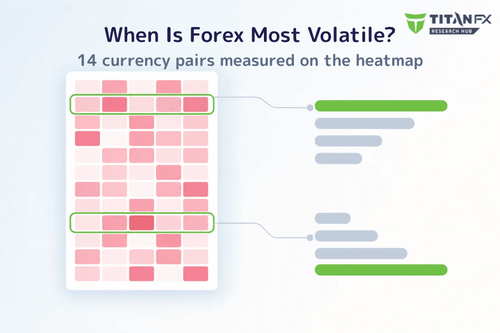
When Is Forex Most Volatile? 14 Currency Pairs Measured on the Volatility Heatmap
The volatility heatmap averages the price range for every day-of-week and hour combination, but each cell holds a price difference in that instrument's own quote scale, so the raw figures cannot be compared across pairs. GBPJPY's most active cell reads 0.45 against EURGBP's 0.0012 — a 375-fold gap that becomes 45 pips against 12 once converted. This article sets out the conversion and uses measured figures for 14 currency pairs: 13 of the 14 peak at server time 15:00-18:00, while AUDNZD concentrates its day into the single hour at 00:00-01:00. It also covers how to read the stacked bar chart below the table and how to work out your own offset from server time.
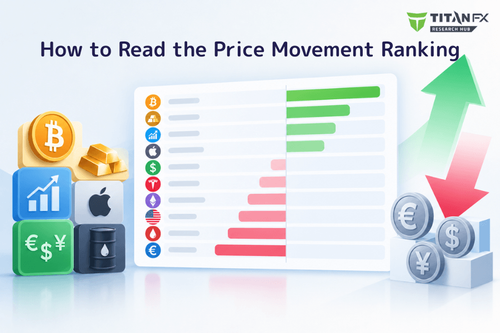
How to Read the Price Movement Ranking: Filter First, Then Sort
The Price Movement Ranking measures the cumulative net change from the start of a period to now, across FX, indices, commodities, US stocks and crypto on a single list. Because the typical size of a move differs so much between those classes, the default mixed view puts the higher-moving categories on top. This guide follows the page controls in order: choosing a category and subcategory, what the Rate of Change thresholds and the three sort orders do, how to read the Detail table below the bars, and how the two period switches differ.
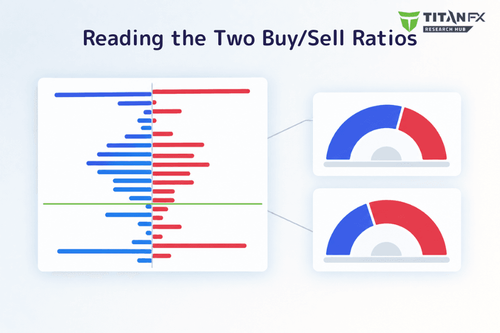
Reading the Two Buy/Sell Ratios: Why They Often Point Opposite Ways
This tool lays out Titan FX client orders: where orders are sitting unfilled, where currently held positions were opened, and two gauges compressing each into a pair of buy/sell percentages. The thing that trips people up is that those two percentages often point opposite ways. This guide covers what each chart counts, how to read them when they disagree, and why a ratio near 50:50 can still sit on a wildly uneven distribution of prices.
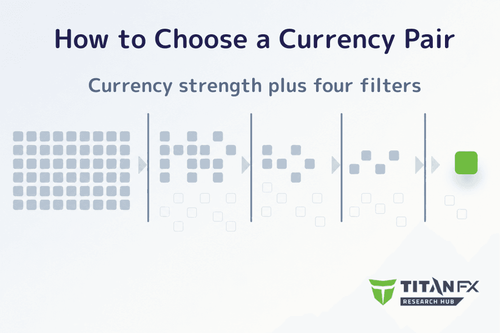
How to Choose a Currency Pair: Screening with the Currency Strength Meter and Four More Tools
Titan FX lists 59 currency pairs in forex alone, and there is no need to open them one at a time. This guide uses the actual screens from the evening of 8 September 2026 to chain five market analysis tools into a single screening sequence: the Currency Strength Meter compresses the list to one candidate, the Economic Calendar checks the scheduled events on both sides of the pair, the Volatility Heatmap decides which hours to watch, the Swap Point Calendar prices the overnight hold, and the Correlation Matrix checks the trade against what is already held. The worked candidate is a short in NZDJPY, set against AUDJPY at a correlation of +0.83 on holding cost. What the five steps leave you with is a candidate worth charting, not a trading signal.
How to Download Historical Data: One-Minute Bar CSV, Account Type and Importing into MT4 and MT5
The Titan FX historical data page supplies one-minute bar data for its main instruments as a CSV download, for use in automated trading backtests. This guide works through the four settings to confirm before downloading and why account type and trading costs have to be aligned: price data is not trading cost, and the 7 US dollars per round turn charged on a Blade account has to be configured in the tester separately, while Micro needs its lot specification checked as well. It also covers the limits of one-minute bars for short-term strategies, what to check after importing into MT4 or MT5, and which tool to use instead when all you want is a rate on a particular day.
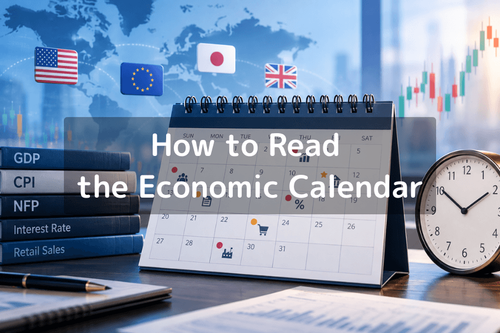
How to Read the Economic Calendar: Filters, Columns and Post-Release Price Moves
The Titan FX Economic Calendar records more than a release schedule: for every indicator it keeps how far the most closely correlated instruments moved within thirty minutes of each past release, and it opens the price chart from that moment. This guide works through the five filters, all seven columns, and the expanded release history, then applies them to two situations: sizing down ahead of payrolls, and checking which releases touch a USDJPY position. It closes with four common misreadings.
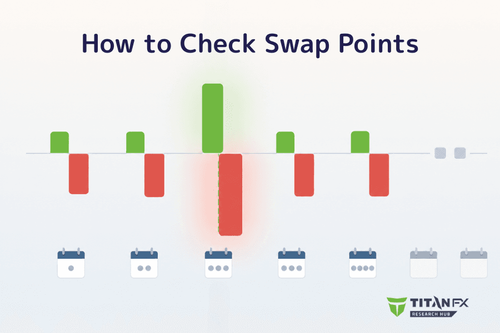
How to Check Swap Points: Reading the Columns, the Triple-Charge Day and Holding Cost
The Titan FX Swap Point Calendar lays out the daily swap for every instrument in both directions and shows how many days each date is charged for. This guide works through the four dropdowns and all four columns in the order you actually use them, then uses figures queried instrument by instrument to settle a point that is widely got wrong: the triple-charge day follows no general rule. Most currency pairs fall on Wednesday, but USDCAD and USDTRY land on Thursday, and precious metals and energy split between Wednesday and Friday inside the same category. It closes with a week-long holding cost calculation and a decision on carrying across the triple day.
Grid Trading Explained: How It Works, Types, Pros and Cons, and Risk Management
Grid trading places buy and sell orders at fixed intervals across a price range, automatically buying low and selling high as the market swings. This guide covers how it works, the common grid types, its advantages and its deadliest one-way-trend risk, and how to set up a grid and manage your capital.
News Trading Explained: How It Works, Key Events, Pros and Cons, and Risk Management
News trading aims to profit from the sharp price moves triggered by a major economic release or event. This guide covers the core idea and mechanics, which events are worth trading (NFP, FOMC, CPI), the advantages and the trickiest execution risks—slippage, spread widening, and fakeouts—and the practical work of scheduling around events and managing risk.
Range Trading: Strategy, Indicators, and Risk Management
Range trading buys near the lower edge (support) and sells near the upper edge (resistance) when price oscillates within a horizontal band, capturing the swing again and again. This guide covers the core idea, how it differs from trend following and counter-trend, its pros and cons, how to execute it, the support/resistance, Bollinger, RSI/KD and ADX tools it uses, and how to manage false-breakout and range-ending risk.
Copy Trading: How It Works, Pros & Cons, and Risk Management
Copy trading links your account to a signal provider and automatically mirrors their trades in proportion. This guide covers the core idea and mechanics, the differences between copy, mirror, and social trading, the pros and the most-overlooked risks, and the practical steps for choosing a provider and managing your capital.

Trading Psychology

Passive Income

Government Bonds

Financial Freedom

Economic Moat

Stock Market vs Economy: Why a High Index Doesn't Mean You'll Feel It
A stock index near record highs reflects market expectations, not the present-day state of the economy. This article unpacks why most households don't feel the bull market, how index composition and wealth distribution drive the disconnect, and which indicators — GDP, CPI, employment, wages, PMI — actually capture the real economy.

How to Set a Stop Loss? 5 Common Methods Compared
The 2% Rule: Risk Management and Position Sizing for Beginners
The 1-2-3 Pattern: Using Price Structure to Spot Reversals and Entries
The 123 pattern uses changes in high–low structure to flag potential trend reversals. This article walks through bullish and bearish setups, entry and stop placement, the strengths and weaknesses of the method, and how it compares with the 2B rule — giving readers a practical framework for trading reversals.

What Are Segregated Accounts? Mechanism, Verification & Titan FX Case

Forex Long Position: Basics, Strategy & Risk Management
A forex long position means buying a currency pair in the expectation that its value will rise, with the aim of selling later at a higher price to capture the rate differential. This guide walks through the definition, trading mechanics, order logic, application scenarios, and risk-control essentials of going long, supported by worked examples and FAQ answers — helping readers build a complete framework for bullish forex trading.

Martingale Strategy: Complete Guide to Doubling-Down, Probability Math, and Historical Blowups
Martingale strategy — doubling the stake after every loss — was introduced by Paul Levy in 1934 and looks mathematically bulletproof: one win erases every prior loss. In the real world it collapses under Gambler's Ruin, exponential capital needs (a 10-loss streak requires 1,023x the initial bet) and broker-imposed margin limits. This guide walks through the origins, probability mathematics, financial-market applications (Forex, CFD, crypto EAs), psychological traps and three critical flaws, then dissects four landmark blowups — LTCM 1998, Amaranth 2006, Barings 1995 and Archegos 2021 (Bill Hwang's 18-year prison sentence, November 2024) — before comparing martingale against the mathematically-opposite Kelly Criterion (Shannon-Kelly 1956, Edward Thorp 19.1% annualized 1969-1988) and surveying global regulatory constraints (US NFA 2-43(b) FIFO, Japan FSA 25:1 cap, EU ESMA 30:1, UK FCA, Swiss franc shock 15 January 2015). Dedicated section for US, European and Asian retail traders with tax treatment.

Titan FX High Leverage: Superior Capital Efficiency with Reliable Risk Protection
An overview of the key features of Titan FX’s high-leverage environment and Zero Cut system. Discover a secure trading environment that enhances capital efficiency while ensuring losses never exceed your deposited funds.
Titan Points Club | How Your Trading Converts to Real Cash Rewards
The Titan Points Club is the official loyalty program by Titan FX, where traders earn cash-redeemable points based on their trading volume. As traders progress through higher status tiers, the reward rate can increase by up to five times, helping to significantly offset effective trading costs, including spreads.

Smart Asset Allocation: Balance Risk & Returns for Your Goals
Spread investments across stocks, bonds, forex, real estate, and precious metals to build a portfolio matching your risk tolerance and financial goals.
Counter-Trend Trading: Strategies, Risks, and Forex Tips
Counter-trend trading goes against market trends. This article explains its definition, pros/cons, methods, and indicators in forex to boost profits.

Trend Following in Forex: Strategies, Indicators, and Tips
Trend following aligns trades with market trends—buy in uptrends, sell in downtrends. Learn its methods, tools like RSI, and risks for better trading.
FOMC 2026 Guide: Schedule, Rate Decisions and Warsh Confirmation Outlook
2026 FOMC schedule, rate decisions since late 2025, March 2026 SEP, and Kevin Warsh's nomination and confirmation outlook.

Why Forex Beginners Fail: 10 Mistakes & 7 Risk Strategies
Forex beginners often lose due to poor knowledge, risk management, and emotional trading. Learn strategies to reduce risk and improve stability.
Titan FX: Safety, Features, Leverage, Products, Platforms
Founded in 2014, Titan FX is renowned for high leverage, tight spreads, and exceptional execution in forex and CFD trading. Offering robust and free trading tools, it’s highly rated by traders worldwide. Registration is simple and fast, requiring no ID or address proof.

How to Access Global Economic Indicators | Titan FX Economic Data Indicator Guide
Global economic indicators are vital tools for forex traders to analyze market trends and predict currency movements. Titan FX offers real-time data from major economies like the US, Europe, and Asia, helping users stay updated and refine their trading strategies. This guide explains how to use Titan FX's economic indicators effectively.
Titan FX Zero Cut System: Protecting Your Deposit
Titan FX’s Zero Cut System ensures traders won’t lose more than their initial deposit by covering negative balances and resetting them to zero.

Beginner's Guide to Learning Forex Trading
Discover essential steps for beginners to learn forex trading, from understanding market basics to developing strategies and practicing with demo accounts.

How Much Capital Is Needed to Start Forex Trading?
Starting forex trading with $100 helps gain experience, but higher capital is needed for substantial profits and effective strategies.

Forex Weekend Trading: Strategies and Risks
Discover how to handle forex markets on weekends, manage risks, and prepare for Monday’s trading despite limited activity.
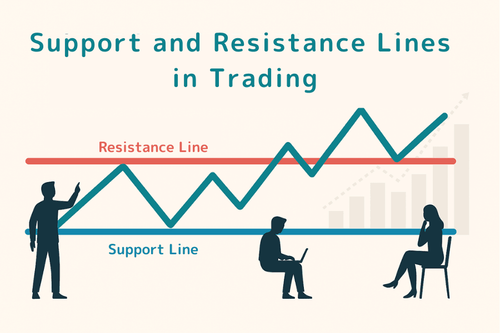
Support and Resistance Lines in Trading
Understand support and resistance lines, how to draw them, and use them to spot potential buy and sell opportunities in trading.
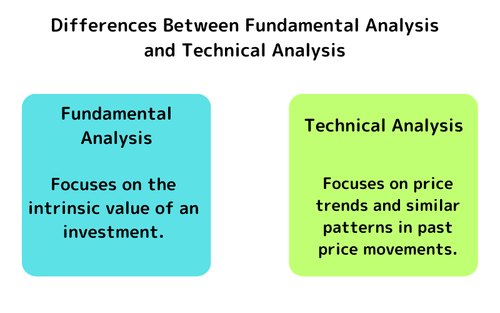
Fundamental vs Technical Analysis: A Comprehensive Guide
A concise guide on fundamental and technical analysis, highlighting their differences, advantages, and applications for smarter investment decisions.
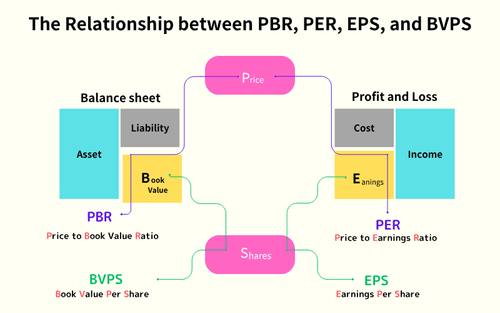
PER, PBR, EPS, and BVPS Explained: Four Essential Stock-Analysis Metrics
Explore the relationships between PER,PBR,EPS, and BPS, key financial metrics,and how they connect to company valuation, market value, and shareholder equity.

What is the Goldilocks economy? History, features, impact
The "Goldilocks Economy" refers to moderate economic growth, not too hot or cold, like the "just right" porridge in the Goldilocks story. This article covers its origin, features, conditions, and impact on investors.

Understand FOMC: Meeting Schedule & Its Econ Impact
As 2024 begins, investors focus on the Federal Open Market Committee (FOMC) meetings. The FOMC's decisions influence global markets and U.S. economic policy, offering key insights into economic trends and policy changes.
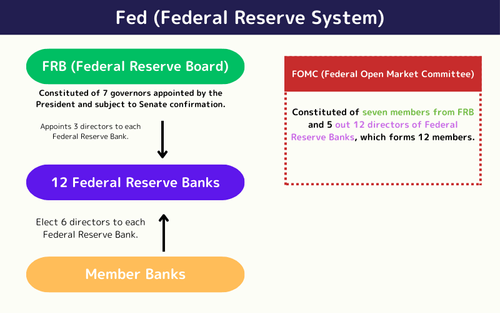
What is the Relationship Among the Fed, FRB, and FOMC?
The Fed is the U.S. central bank, run by the FRB, which includes 12 regional banks. The FOMC, within the FRB, holds meetings to set economic policies like interest rates.
This column offers an in-depth look at the U.S. stock market structure, investment strategies, and analysis techniques, covering stock selection, financial reports, and methods of technical and fundamental analysis. It aims to equip investors with key ele

Japan's Four Major Stock Exchanges: History, Market Structure, Tradable Indices and Stocks
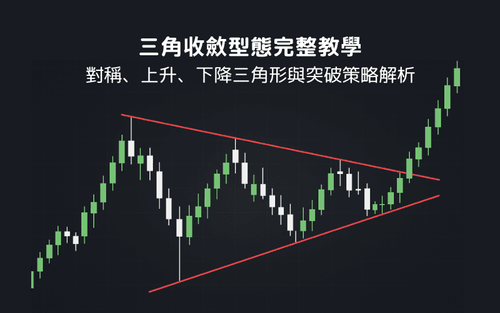
Triangle Patterns Complete Guide: Symmetrical, Ascending, Descending and Breakout Strategies
Triangle patterns signal converging volatility before a breakout. Learn the symmetrical, ascending, and descending types and how to trade them.
What Is Spot Trading? A Complete Guide to Mechanics, Popular Assets, and Trading Essentials
Spot trading transacts at the current real-time market price with no expiry. Learn the mechanics, popular assets (gold, forex, oil, indices), and risks.
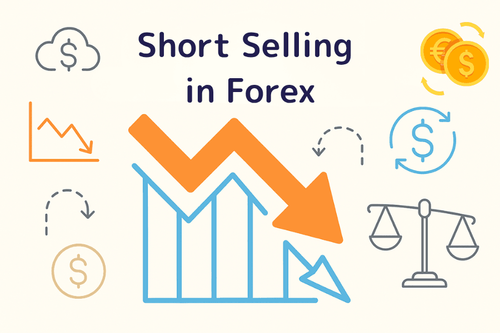
Short Selling in Forex: A Complete Guide to Mechanics, Strategy, and Risk Control
Short selling in forex profits from currency depreciation by selling first and buying back later. Mechanics, applications, and risk control explained.
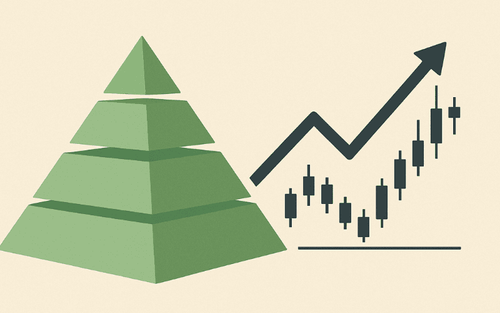
Pyramid Trading: A Complete Guide to Position Adding and Trend-Following Strategies
Pyramid trading is a position-management strategy that scales into a winning trend with each add smaller than the last. Learn the four pyramiding styles, upright vs. inverted structures, and how to ap
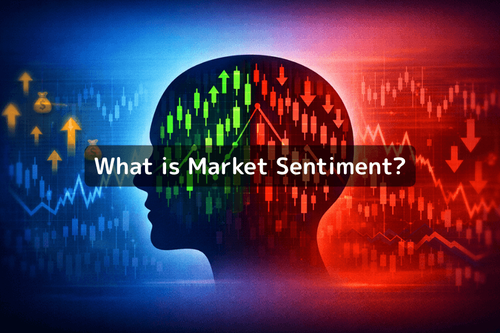
What Is Market Sentiment? How It Drives Forex and CFD Markets
How market sentiment drives forex and CFD prices through risk appetite, news interpretation, and herd behavior. Plus VIX, Fear & Greed, and Long/Short ratios.
Market Anomalies Explained: Types, Real-World Examples, and Trading Applications
A guide to market anomalies — patterns repeated in history but unexplained by EMH. Calendar, seasonal, event-driven, and behavioral types in FX and equities.

Forex Trading Strategy: A Complete Guide for Beginners to Build and Execute
A beginner's guide to forex trading strategy: the four core components, trend-following vs counter-trend, trading styles, selection, and execution.

Can You Lose Money in Forex? Beginner's Guide to Risks and Defense
Yes, you can lose money in forex — and beginners are most at risk. This guide separates environmental causes (spreads, swaps, slippage, leverage) from behavioral causes (no plan, revenge trading, over