Home
Home- Investment Guide: Strategies for Stocks, Forex, and Metals
- How to Access Global Economic Indicators
How to Access Global Economic Indicators | Titan FX Economic Data Indicator Guide

Global economic indicators are essential tools for forex traders and investors, helping them analyze market trends, predict currency movements, and make more informed trading decisions.
Titan FX offers global economic indicators covering major economies such as the United States, Europe, and Asia, providing traders with real-time economic data to quickly and accurately grasp the latest global market changes. This article will provide a detailed guide on how to effectively use Titan FX's economic indicator tools.
How to Use Global Economic Indicators
1. Select Continent/Country
You can choose economic indicators based on specific countries or regions. The available options include:
| Market | Country/Region |
|---|---|
| North America | United States, Canada |
| Asia | Japan, China, Singapore, Hong Kong |
| Europe | Eurozone, Germany, France, United Kingdom, Switzerland, Sweden, Norway, Russia |
| Oceania | Australia, New Zealand |
| Emerging Markets | Brazil, India, South Africa, Turkey, Mexico |
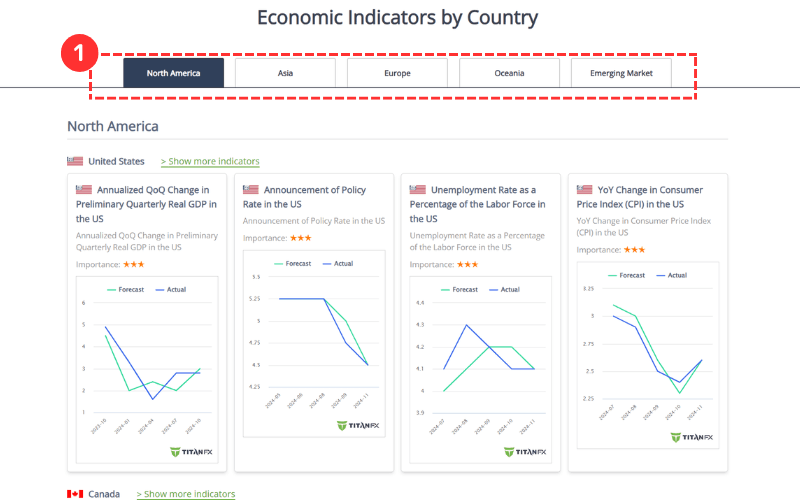
2. View Key Economic Indicators of the Selected Country
The homepage displays several key economic indicators for the selected country, presented in a chart format for easy visualization.
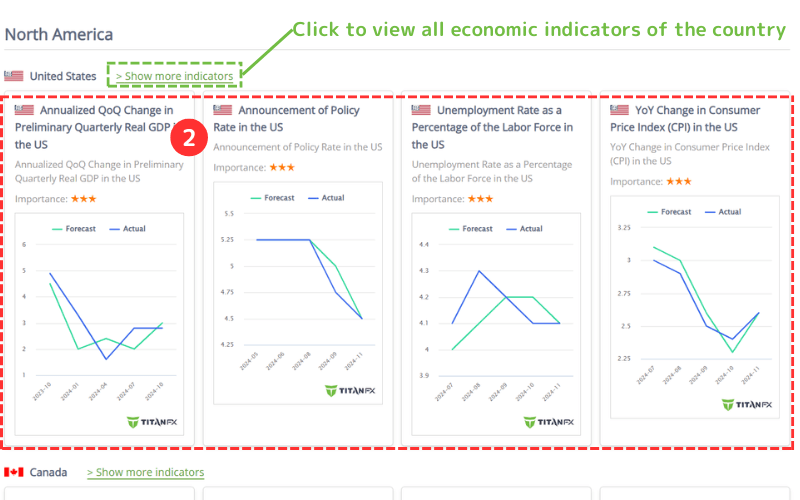
Click on any indicator to access more detailed data.
To explore all economic indicators of the country, click on [Show more indicators] for further details.
After accessing the page for all economic indicators of the selected country, you can filter and quickly review relevant data based on indicator type and importance.
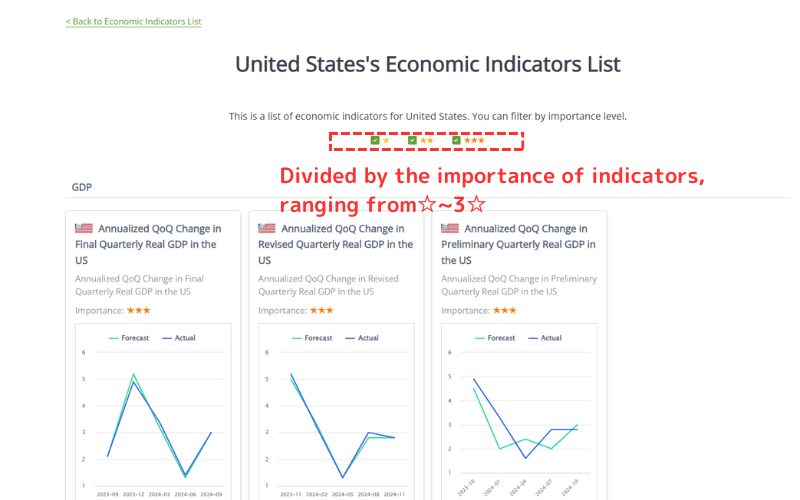
Importance Explanation
Economic indicators are ranked by importance, represented by 1 to 3 stars. The more stars, the greater the indicator's impact on the market.
| Symbol | Explanation |
|---|---|
| ☆ | Indicators with minimal impact, often reflecting short-term trends and serving as supplementary references. |
| ☆☆ | Moderately important economic data that may cause market fluctuations and should be monitored accordingly. |
| ☆☆☆ | Highly significant indicators that typically have a direct influence on market trends and require close attention. |
Understanding the Economic Indicator Details Page
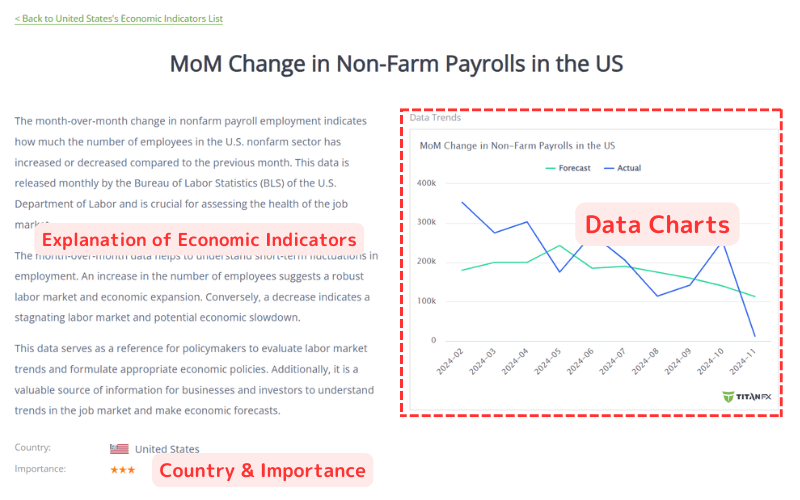
The economic indicator details page consists of two main sections. Below, we use the U.S. Non-Farm Payroll data as an example to explain its structure and content.
Section 1:
This section provides an explanation of the data indicator along with a graphical representation for better visualization.
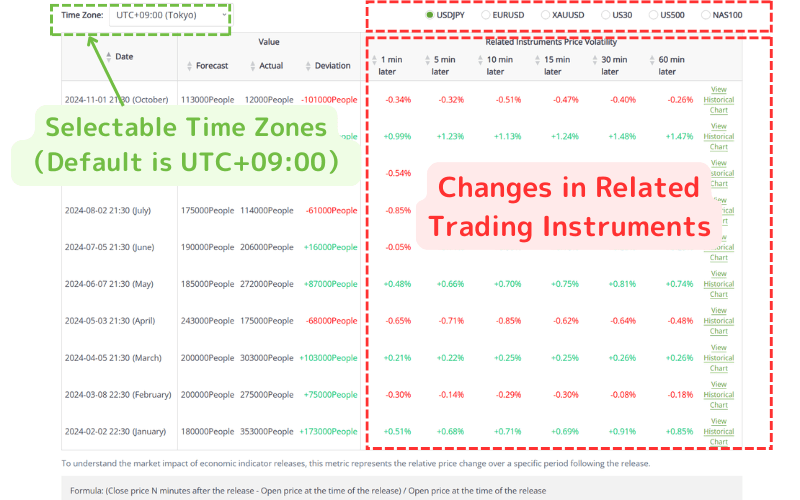
Section 2:
The second section displays a detailed list of the latest and historical data.
You can select your preferred time zone from the top-left corner, with the default set to UTC+9.
On the right side, you can view the price changes of major assets following the release of the economic indicator. These include USDJPY, EURUSD, XAUUSD, US30, US500, and NAS100, making it easier to analyze market reactions effectively.