 Home
Home- Investment Guide: Strategies for Stocks, Forex, and Metals
- Support and Resistance Lines in Trading
Support and Resistance Lines in Trading
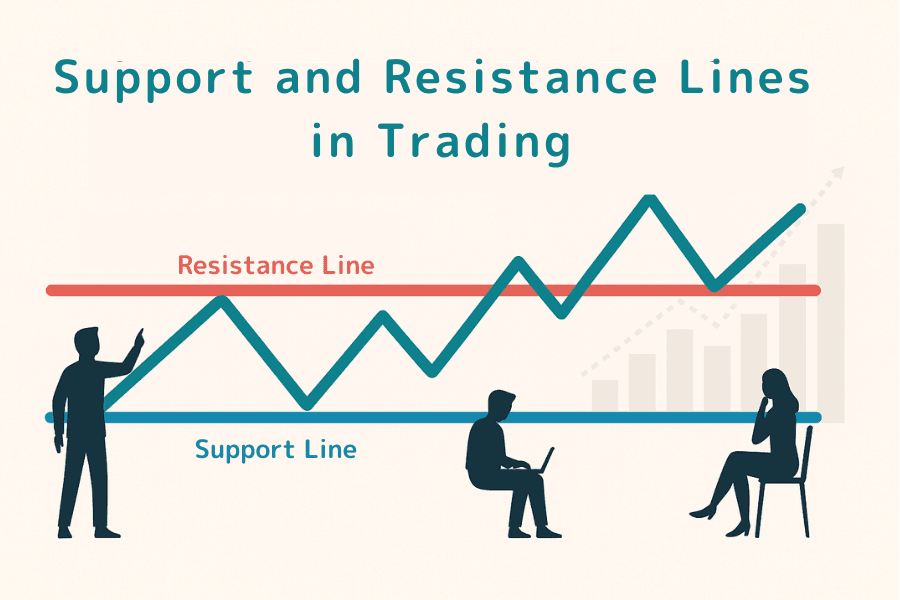
If you watch a chart for a while, you will notice prices stalling or bouncing around the same levels again and again. Those "invisible walls," drawn as lines, are support and resistance. Because so many market participants watch the same levels, they often become turning points for buying and selling.
This article explains the basic concepts of support and resistance, how to draw them on a chart, and how to apply them in your trading strategy.
- Definition: Support is a floor where price tends to bounce; resistance is a ceiling
- Why it forms: It stems from market psychology — many traders watch the same levels
- How to draw: Connect prior highs and lows; more touches mean a stronger level
- How to use: Buy near support, sell near resistance; roles flip on a breakout
- Cautions: Don’t draw too many lines, over-refine, or rely on them blindly
- 1. What are Support and Resistance Lines?
- 2. How to Find Support and Resistance Lines?
- 3. How to Use Support and Resistance Lines to Find Buy and Sell Signals?
- 4. Titan FX’s Free Tool for Identifying Support and Resistance Levels
- 5. Important Notes When Using Support and Resistance Lines
- 6. Frequently Asked Questions (FAQ)
1. What are Support and Resistance Lines?
In technical analysis, support and resistance are two core concepts that help traders and investors understand and predict future price movements.
Support Line
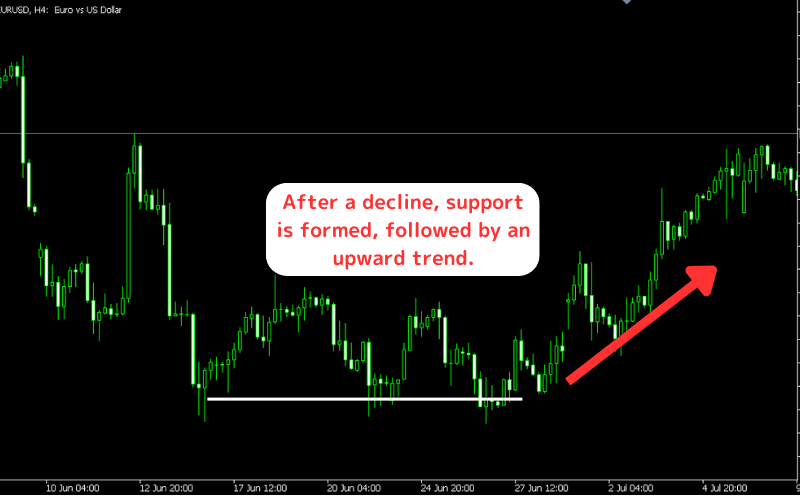
Support refers to the level at which prices are expected to stop falling and reverse to the upside. This level is typically formed by the low points on the price chart.
The Support Line is a line drawn through these low points to identify and confirm the support level.
Support lines can also be referred to as resistance lines or support levels because they resist further price declines.
Common reasons for the formation of support include:
| Support Formation Cause | Explanation |
|---|---|
| Historical Price Levels | At these price levels, there were significant buy orders in the past, causing the price to rebound. |
| Psychological Barriers | Market participants consider a particular price level a reasonable buying point, leading to more buyers entering when the price approaches that level. |
Resistance Line
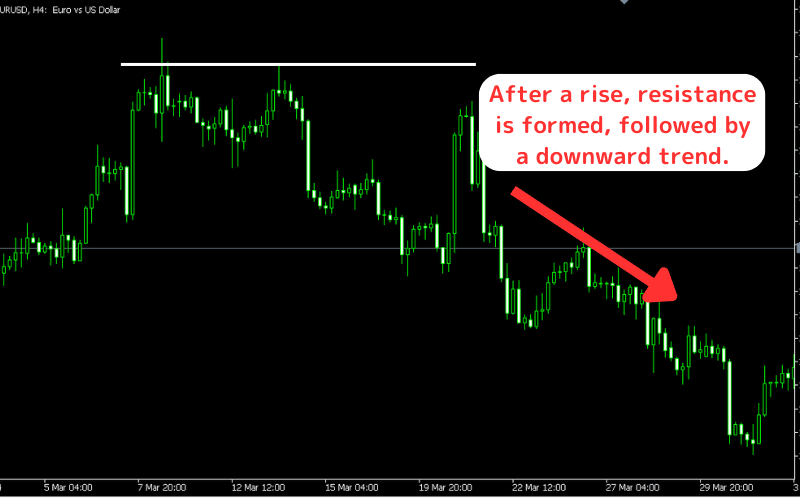
Resistance refers to the level at which prices are expected to stop rising and reverse to the downside. This level is typically formed by the high points on the price chart.
The Resistance Line is a line drawn through these high points to identify and confirm the resistance level.
Resistance lines can also be referred to as resistance barriers or resistance levels because they prevent further price increases.
Common reasons for the formation of resistance include:
| Resistance Formation Cause | Explanation |
|---|---|
| Historical Price Levels | At these price levels, there were significant sell orders in the past, causing the price to reverse. |
| Psychological Barriers | Market participants consider a particular price level a reasonable selling point, leading to more sellers entering when the price approaches that level. |
Understanding support and resistance is important because these levels help traders make buy and sell decisions. Buying at support and selling at resistance can increase the probability of successful trades.
2. How to Find Support and Resistance Lines?
Finding support and resistance levels is crucial for technical analysis. These lines help us identify critical price turning points, allowing for more effective trading strategies.
Drawing the Support Line
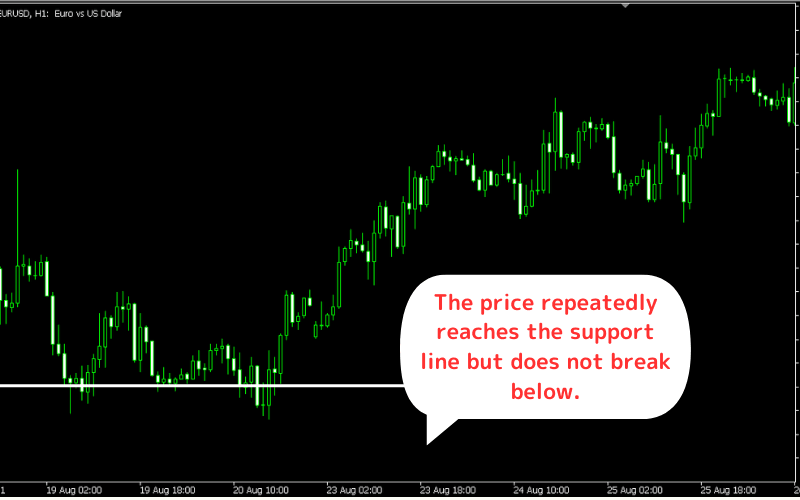
Traders can draw the support line by connecting at least two low points on a candlestick chart and extending the line to the right. This line represents a price level that is considered an important support point in the market.
For example, on a EUR/USD 1-hour chart, we can connect the most recent two low points. When the price touches this support line, it typically stops falling and reverses upward, indicating that this line is seen as a valid support level in the current market.
Drawing the Resistance Line
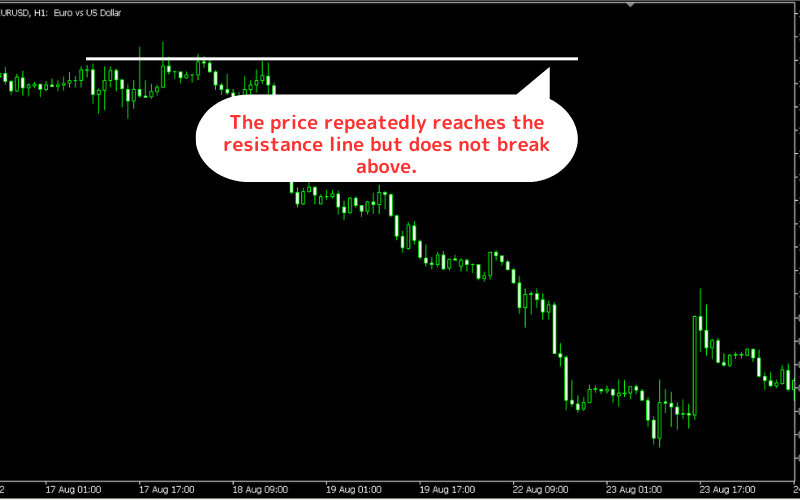
Traders can draw the resistance line by connecting at least two high points on a candlestick chart and extending the line to the right. This line represents a price level that is considered an important resistance point in the market.
For example, on a EUR/USD 1-hour chart, we can connect the most recent two high points. When the price touches this resistance line, it typically stops rising and starts to fall, indicating that this line is seen as a valid resistance level in the current market.
3. How to Use Support and Resistance Lines to Find Buy and Sell Signals?
Support and resistance lines are essential tools in technical analysis, helping traders identify potential buy and sell signals. Below are detailed methods and strategies.
Support Line as a Reference for Buy Signals
A support line is a line that is considered a "bottom" reference point, where the price is unlikely to continue falling. This line is also called the lower support line and is drawn at the bottom of the chart, serving as a reference for buy points.
Since the support line is drawn based on price reversals after declines, it’s understood that there are many buy orders near this price level. This means that at this low point, many buyers entered the market, supporting the price, which is why it’s called the lower support line.
Resistance Line as a Reference for Sell Signals
In contrast to the support line, the resistance line is a line considered a "top" reference point, where the price is unlikely to continue rising. This line is also called the upper resistance line and is drawn at the top of the chart, serving as a reference for sell points.
Near the resistance line, the number of sell orders increases, which may lead to a price reversal from an uptrend to a downtrend. This means that at the resistance line, sellers exert stronger pressure, preventing the price from continuing upward.
4. Titan FX’s Free Tool for Identifying Support and Resistance Levels
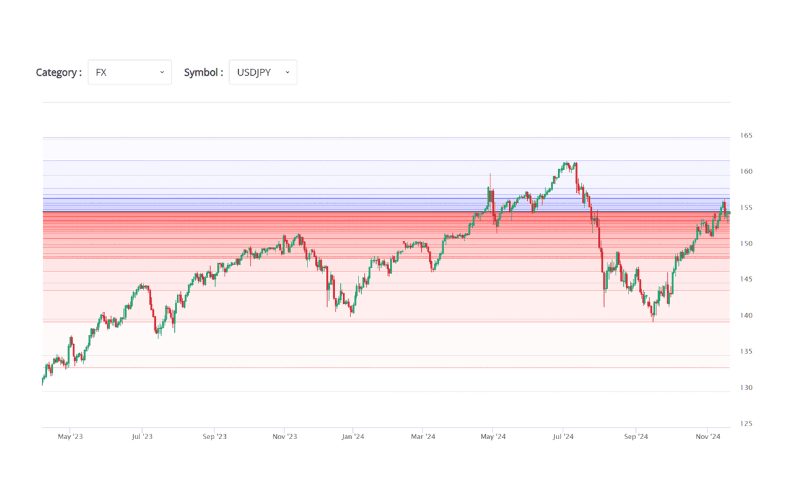
Titan FX offers a free online tool to help you identify support and resistance levels.
This tool uses pivot points, high and low points from specific periods, Relative Strength Index (RSI), moving averages, and standard deviation to determine support and resistance levels.
You can use this tool to analyze forex, stock indices, commodities, US stocks, Japanese stocks, and cryptocurrencies.
Quickly View Support and Resistance Levels Tool5. Important Notes When Using Support and Resistance Lines
When using support and resistance lines in forex (FX), here are three important points to keep in mind:
1.Don’t Draw Too Many Lines
When using support and resistance lines in forex, avoid drawing too many lines.
These lines are only effective when they are closely watched by many traders and have clear reversal points. Unclear lines are often ineffective.
Drawing too many lines not only makes the chart difficult to read but also makes it harder to differentiate which lines are clear and relevant.
Therefore, focus on identifying clear and significant lines and use those for trading, rather than cluttering the chart with too many lines.
2.Don’t Draw Lines Too Precisely
When using support and resistance lines, don’t try to be overly precise when drawing lines.
Even if these lines are clear, prices may not always reverse at the exact same price level.
When forecasting price movements, it’s better to think of these lines as zones or ranges rather than exact lines. This way, you avoid being misled and won’t miss trading opportunities.
Thus, remember that prices typically reverse near these levels, and draw lines accordingly.
3.Don’t Rely Too Heavily on These Lines
Support and resistance lines are not always reliable, so don’t rely too much on them for reversal trades.
While support and resistance lines that have seen multiple reversals in the past are more likely to reverse again, there’s no guarantee they will always do so.
Over-relying on these lines for trades can result in significant losses if the price doesn’t reverse as expected.
Keep in mind that prices don’t always follow these lines, and be prepared for alternative outcomes.
6. Frequently Asked Questions (FAQ)
Q1. What is the difference between support and resistance?
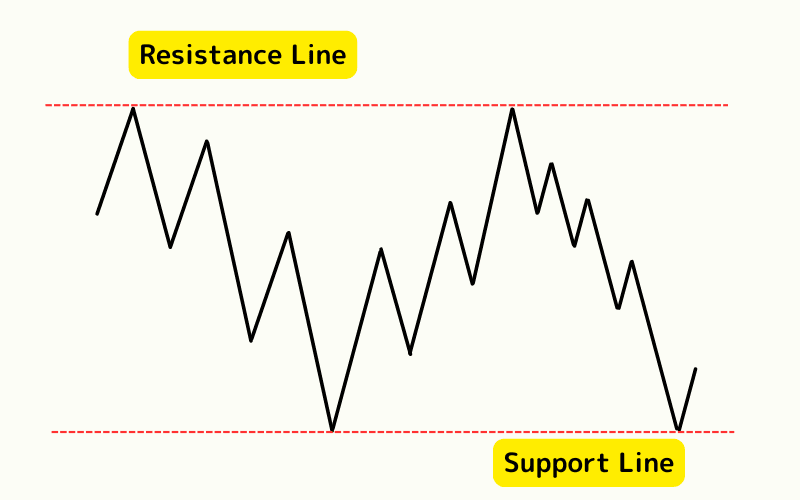
A support line is a "floor" where falling prices tend to bounce because buyers step in, while a resistance line is a "ceiling" where rising prices tend to stall because sellers take over.
Q2. How do I draw the lines?
Connect prior lows that bounced (support) or prior highs that reversed (resistance) with a horizontal line. The more times a level has been touched, the more traders watch it and the more reliable it is.
Q3. What happens when price breaks through a line?
Roles often flip after a breakout: once resistance is broken it tends to become new support, and once support is broken it tends to become new resistance.
Q4. Can I trade on support and resistance alone?
No — they are not foolproof and do not always hold. Combine them with other tools such as moving averages or volume, and always use a stop-loss.
Further Reading
Titan FX Trade Strategy Research Lab covers forex (FX), commodities (oil, precious metals, agricultural products), stock indices, U.S. equities, and crypto assets — producing educational content for retail investors across asset classes.
Primary Sources (by Category)
- Reference: Investopedia — Support and Resistance
- Foundational works: John J. Murphy, Technical Analysis of the Financial Markets (1999)