 Home
Home- Investment Guide: Strategies for Stocks, Forex, and Metals
- Fundamental vs Technical Analysis: A Comprehensive Guide
Fundamental vs Technical Analysis: A Comprehensive Guide
"Should I follow the fundamentals or the charts?" is a choice almost every trader faces. Yet the best traders rarely rely on just one—they know when to switch between and combine the two.
This article breaks down the core differences between the two approaches, the key indicators to watch in forex and stocks, common technical tools, their pros and cons, and how to adjust the balance to market conditions.
- Core difference: Fundamentals track intrinsic value and trend; technicals track price and psychology.
- Fundamental data: Economic data, rate policy, and earnings are key for forex and stocks.
- Technical tools: Trend tools (MAs, trendlines) and oscillators (RSI, stochastics) each have a role.
- How to combine: Fundamentals for the long term and turns, technicals for timing—adjust by conditions.
- Common myths: More indicators isn't better; good fundamentals don't mean instant gains—still use stops.
1. Overview
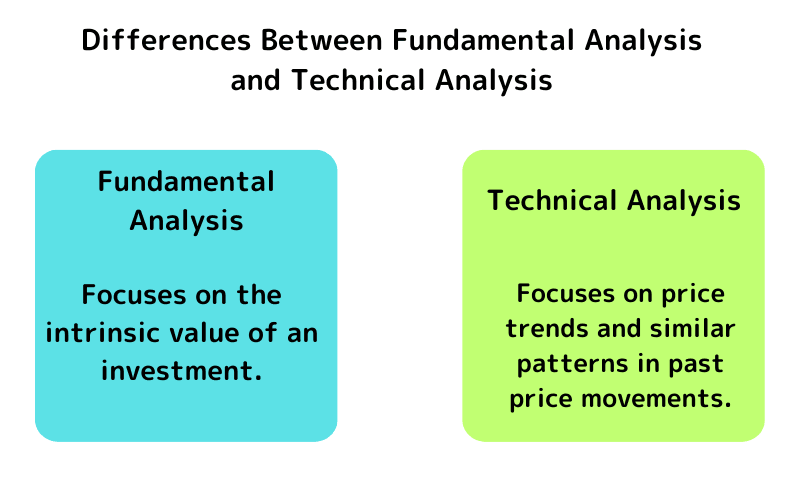
Fundamental analysis focuses on the intrinsic value of the investment target.
Technical analysis, on the other hand, emphasizes price, trading volume, and other supply-demand changes, analyzing investor behavior to identify patterns similar to past price movements.
Although these two methods differ in their approaches to investment judgment, their goal is the same: to achieve higher returns and minimize potential losses.
Both fundamental and technical analysis should be considered from a balanced perspective.
This article will detail the differences between the two methods, giving you a clear understanding of the overall picture.
2. Types of Fundamental Analysis
As mentioned, fundamental analysis focuses on intrinsic value. However, the key indicators differ between forex trading and stock investment.
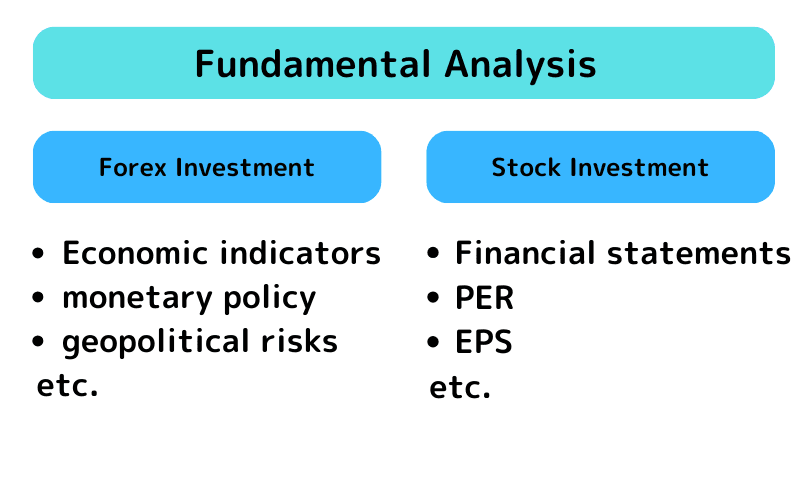
Fundamental Analysis in Forex Trading
1. Economic Indicators
Economic indicators are data released daily by governments or central banks, closely monitored by investors. These timely indicators reflect the latest market conditions. Some data might not have an immediate impact but are critical for assessing a country’s long-term economic health.
Examples of Economic Indicators:
Time of release
Indicator name
Previous data, forecasts, and results
You can view these details via an economic calendar provided by forex companies.
2. Monetary Policy
Monetary policies like interest rate changes or quantitative easing play a crucial role in influencing currency values. For carry trades, monetary policies directly impact swap rates, though analyzing them can be challenging.
3. Key Officials' Statements
Statements by government or central bank officials can significantly influence market movements. Deciphering these statements to understand future policies or economic conditions requires high expertise.
4. Geopolitical Risks
Geopolitical risks, such as conflicts or instability, often make affected economies seem unreliable. Understanding the geopolitical background of a currency is essential for informed trading decisions.
Fundamental Analysis in Stock Investment
1. Financial Statements
Companies release financial statements, such as balance sheets, income statements, and cash flow statements, during earnings reports. These provide insights into a company's financial health.
2. Key Financial Ratios
Equity Ratio: Measures financial stability; higher ratios indicate stability.
Current Ratio: Indicates short-term debt-paying ability; higher ratios suggest safety.
Cash Flow: Tracks cash inflows and outflows, a vital indicator even for profitable companies.
3. Valuation Metrics
PER (Price-Earnings Ratio): Assesses stock price relative to earnings; lower is better.
PBR (Price-to-Book Ratio): Measures stock price against book value; lower values indicate undervaluation.
4. Profitability Ratios
ROE (Return on Equity): Measures how effectively shareholder capital generates profit; higher is better.
ROA (Return on Assets): Evaluates overall asset efficiency in generating profit.
5. Dividends and Yield
Dividend yield is an important indicator for long-term investors, measuring the ratio of dividends to investment cost.
3. Types of Technical Analysis
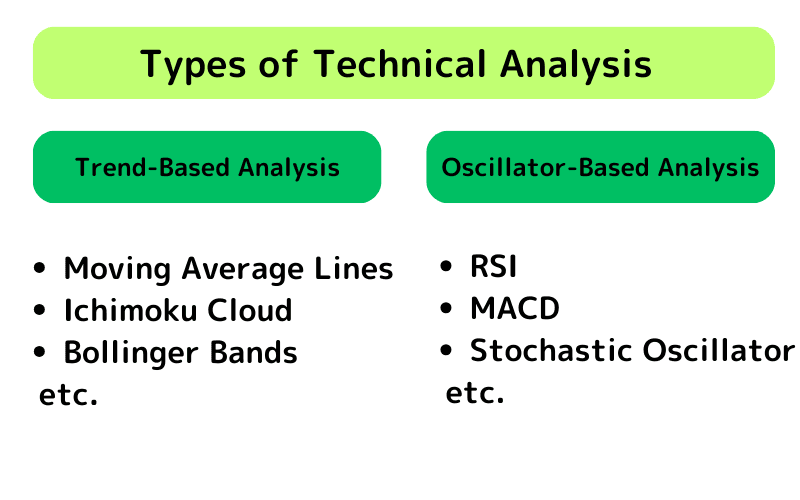
Technical analysis is generally categorized into trend-based and oscillator-based methods.
Trend-Based Analysis
1. Moving Average Lines
Widely used to identify market trends. For example:
Golden Cross: Buy signal when the short-term average crosses above the long-term average.
Death Cross: Sell signal when the short-term average crosses below the long-term average.
2. Ichimoku Cloud
This Japanese-developed indicator features a "cloud" as a resistance area. It includes five lines (e.g., Base Line, Conversion Line, Lagging Span).
Buy signals: Conversion Line crossing above Base Line.
Sell signals: Conversion Line crossing below Base Line.
3. Bollinger Bands
Measures price volatility using moving averages and standard deviation.
Reverse trades when prices exceed ±2 standard deviations.
Trend trades when prices move along the upper band.
Oscillator-Based Analysis
1. RSI (Relative Strength Index)
Values range from 0–100.
Over 70%: Overbought signal; below 30%: Oversold signal.
2. MACD (Moving Average Convergence Divergence)
Tracks momentum by comparing short-term and medium-term averages.
Golden Cross and Death Cross indicate potential market reversals.
3. Stochastic Oscillator
Indicates overbought (above 75%) or oversold (below 25%) conditions.
Buy signals: %K crosses above %D.
Sell signals: %K crosses below %D.
4. Advantages and Disadvantages
| Method | Advantages | Disadvantages |
|---|---|---|
| Fundamental Analysis | Suitable for long-term investment | Time-consuming to analyze |
| Technical Analysis | Efficient for short-term trades | Unsuitable for long-term trades |
5. Combining Fundamental and Technical Analysis
Balancing both approaches is crucial. Here's how they complement each other:
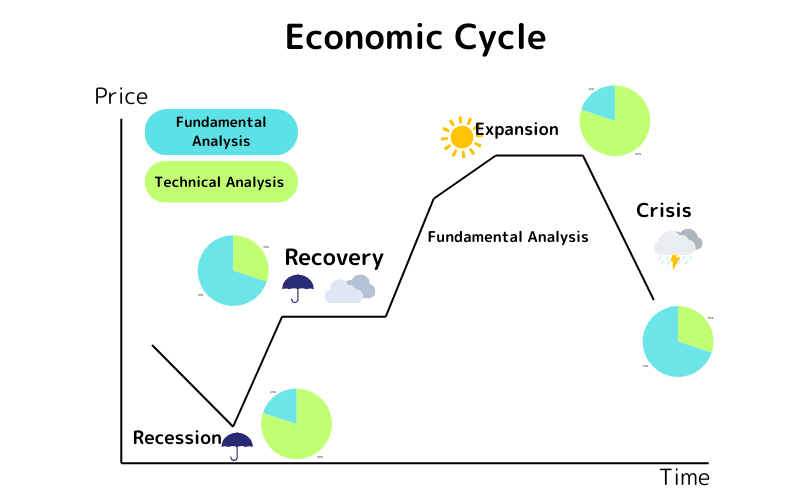
Market Cycle vs. Analysis Type
-
At market lows: Prioritize technical analysis to identify reversals.
-
In sideways markets: Emphasize fundamental analysis for valuation.
-
At market highs: Focus again on technical analysis for overvaluation signals.
6. Frequently Asked Questions
Q1. Should beginners learn fundamental or technical analysis first?
There is no fixed order. Many start with technicals because charts give quick visual feedback, then add fundamentals for the bigger picture. Treat them as complementary tools rather than an either/or choice.
Q2. Which fundamental indicators matter most in forex?
Interest-rate decisions and central-bank policy, inflation (CPI), and employment data such as US non-farm payrolls are among the most market-moving.
Q3. How many technical indicators should I use?
Two or three is usually enough. Stacking more indicators that say the same thing adds noise, not insight; pair one trend indicator with one momentum indicator.
Q4. What if the fundamentals look strong but the price keeps falling?
Price reflects more than fundamentals—sentiment, positioning, and liquidity also matter. Respect your stop-loss and avoid averaging down against a clear downtrend.
Q5. Does short-term trading also need fundamentals?
Yes. Scheduled events such as rate decisions and key data releases can trigger sharp moves, so even short-term traders should watch the economic calendar.
7. Conclusion
Fundamental analysis evaluates the economic conditions of countries or companies, while technical analysis uses statistical methods to assess market trends.
Both are essential tools for investment decisions. Combining them can help achieve better investment outcomes.
Further Reading
Titan FX Trade Strategy Research Lab covers forex (FX), commodities (oil, precious metals, agricultural products), stock indices, U.S. equities, and crypto assets, producing educational content for retail investors across asset classes.
Primary Sources (by Category)
- Educational Resources: Investopedia, BabyPips
- Market Analysis: Fundamental and technical analysis from Bloomberg, Reuters, and other financial media