Capitalization Weighted Index
The capitalization-weighted index is the most widely used design for stock-market indices around the world. Its core rule is straightforward: the larger a company's market capitalization, the larger its weight in the index. That means heavyweight names dominate the index path, while small-cap moves leave a much smaller imprint.
For investors, a capitalization-weighted index serves two roles at once. It is the core gauge of overall market direction, and it is the benchmark that most ETFs, mutual funds, and institutional portfolios are designed to track.
Once you understand how it is calculated, what it does well, and where it falls short, market moves stop feeling random and start making sense as a function of where the capital is actually concentrated.
- Cap-weighted basics. Market cap = price × shares outstanding. Bigger cap, bigger weight. Used by most major indices worldwide.
- Calculation and adjustment. Index level = (current total market cap / base market cap) × base index, with the base adjusted for splits, buybacks, and constituent changes.
- Major examples. S&P 500 (US), TOPIX (Japan), MSCI World, FTSE Global Equity Index all use this design.
- Strengths and weaknesses. Reflects actual capital flow, but concentrates in mega-caps and dominant sectors, and inherits valuation distortions.
- How to use it. Anchor with S&P 500 or TOPIX as the core, then layer equal-weight or sector indices to capture the structural detail.
- 1. What Is a Capitalization-Weighted Index?
- 2. Calculation and Adjustment Mechanism
- 3. Strengths and Weaknesses
- 4. Major Capitalization-Weighted Indices
- 5. Capitalization-Weighted vs Price-Weighted vs Equal-Weight
- 6. Investor Perspective: How to Read It
- 7. FAQ: Capitalization-Weighted Indices
- 8. Summary
1. What Is a Capitalization-Weighted Index?
A capitalization-weighted index is the most common design used for stock-market indices globally.
The core idea: the larger a company's market capitalization, the larger its weight in the index. In practice, large-cap moves drive the index, and small-cap moves contribute much less.
This structure makes capitalization-weighted indices a clean reflection of where capital is actually flowing and which sectors dominate the market at any given moment.
Most well-known benchmarks today use this method, including the S&P 500, TOPIX (Tokyo Stock Price Index), the MSCI World Index, and the FTSE Global Equity Index. It is the standard benchmark family for both institutional and retail investors.
2. Calculation and Adjustment Mechanism
The calculation rule is simple: market capitalization is the weight. A larger market cap means a larger contribution to the index level.
Calculating Market Cap
Market cap is calculated as:
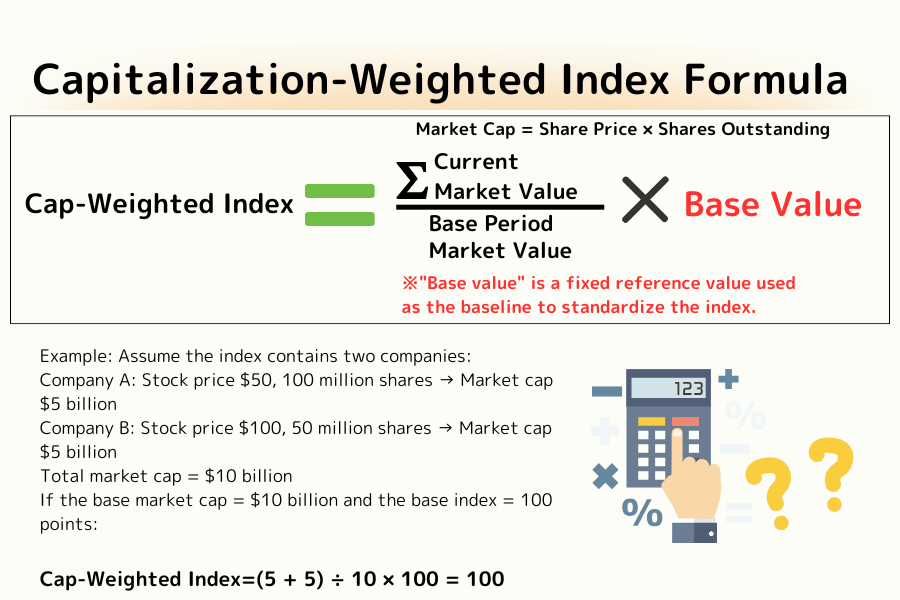
Market Cap = Share Price × Shares Outstanding
This is the total valuation the market assigns to a given company. For example:
- A company at $50 share price with 100 million shares → market cap = $5 billion.
- A company at $100 share price with 50 million shares → market cap = $5 billion.
Two very different share prices, but the same market cap—so they carry the same weight in the index.
The Index Formula
Capitalization-Weighted Index = (Current Total Market Cap / Base Market Cap) × Base Index Level
- Base market cap. Total market cap at the index's inception, used as the reference.
- Base index level. Usually set to 100 or 1,000 for tracking convenience.
Adjustments for Corporate Actions
Index providers do not leave the index untouched. Several events alter the total market cap without representing real market moves, so the base market cap is adjusted to preserve continuity:
- Secondary offerings or buybacks. Shares outstanding change, moving total cap.
- Stock splits and stock dividends. Share count changes mechanically.
- Mergers or delistings. Constituents are swapped, shifting the total cap.
In each case, the base market cap is recalibrated so that index changes still reflect real market price movement, not mechanical events.
Worked Example
Suppose an index contains two stocks:
- Company A: $50 × 100M shares = $5B market cap.
- Company B: $100 × 50M shares = $5B market cap.
Total cap = $10B. With base cap = $10B and base index = 100, the index level = 100 points.
If Company A's price rises to $60, its market cap becomes $6B and the total cap becomes $11B → index = 110 points.
This design captures where capital is actually moving, which is why it has displaced price-weighted methods as the global default.
3. Strengths and Weaknesses
Capitalization weighting dominates modern index construction. Here is a clean read of why—and where it falls short.
Strengths
| Strength | Why It Matters | Detail |
|---|---|---|
| 1. Reflects actual capital flow | Larger cap = larger weight | The index mirrors investor money flow and the contribution of major firms to overall direction. |
| 2. High market representation | The global standard | S&P 500, TOPIX, MSCI World—all cap-weighted. Provides a clean snapshot of the broad market. |
| 3. Portfolio-compatible | Built for passive investing | Most ETFs and index funds match cap-weighted benchmarks, so tracking error stays low. |
Weaknesses
| Weakness | Why It Matters | Detail |
|---|---|---|
| 1. Mega-cap dominance | A few names can carry the index | When Apple, Microsoft, TSMC and similar names are concentrated at the top, mid- and small-cap signals are drowned out. |
| 2. Sector concentration risk | The biggest sectors disproportionately influence the index | If technology or energy carries excessive weight, the diversification benefit shrinks. |
| 3. Valuation distortion | Overvalued mega-caps amplify the move | When large-cap valuations stretch away from fundamentals, the entire index follows—the benchmark gets noisier. |
4. Major Capitalization-Weighted Indices
Cap-weighting is the standard methodology behind most major benchmarks. A quick tour:
S&P 500 Index (US)
The S&P 500 tracks the 500 largest US companies by market cap and stands as one of the most-watched equity benchmarks in the world.
Mega-caps like Apple, Microsoft, Amazon, and Alphabet exert outsized influence on index direction. Because the weighting aligns with capital flow, the S&P 500 is the dominant tracking target for both active and passive products globally.
TOPIX (Tokyo Stock Price Index, Japan)
TOPIX is a cap-weighted index covering Prime Market listings on the Tokyo Stock Exchange and is the standard broad-market benchmark for Japan.
Heavyweights like Toyota, Sony Group, Mitsubishi UFJ Financial Group, and Keyence drive the index direction. After the TSE 2022 market restructuring, governance metrics and free-float adjustments have also become part of the conversation around TOPIX.
(Note: Japan's Nikkei 225, often quoted in headlines, is price-weighted—not cap-weighted. The two are different methodologies covering the same market.)
MSCI World Index
The MSCI World Index covers around 1,500 large- and mid-cap stocks across 23 developed markets, and is the default global benchmark for institutional portfolios.
It captures the broad behavior of developed markets in a single number, which is why fund managers use it as a yardstick for cross-border performance.
FTSE Global Equity Index
The FTSE Global Equity Index, produced by FTSE Russell, covers thousands of companies across developed and emerging markets, and offers another major cap-weighted global benchmark.
It balances regional and developed-vs-emerging exposures cleanly, which is why it appears in global ETFs, sovereign wealth fund allocations, and institutional strategic asset allocation models.
5. Capitalization-Weighted vs Price-Weighted vs Equal-Weight
How an index is weighted changes the story it tells. Here is a quick comparison of the three main methods:
| Item | Price-Weighted | Capitalization-Weighted | Equal-Weight |
|---|---|---|---|
| Weighting basis | Share price | Market capitalization | Same weight for every name |
| Representation | Skewed to high-priced stocks | Faithful to capital flow | Equal voice per company |
| Strengths | Simple, long history | Aligned with market structure | Diversification, structural balance |
| Weaknesses | Easily distorted | Mega-cap dominance | Diverges from real market structure |
| Examples | Nikkei 225, Dow Jones Industrial Average | S&P 500, TOPIX | S&P 500 Equal Weight |
6. Investor Perspective: How to Read It
Capitalization weighting is the most representative and most tracked design in modern markets. Three angles help turn that into a usable read:
Angle 1: Watch the Mega-Caps
Because large caps carry the most weight, top-name moves often dictate index direction.
Following the earnings, sector news, and valuation drift of those names gives you a cleaner sense of whether the index is moving on structural signals or on noise at the small-cap edges.
Angle 2: Understand the Benchmark Role
Most global funds and ETFs use cap-weighted indices (S&P 500, TOPIX, MSCI World) as their benchmark.
For long-term investors, that benchmark is the baseline reading for overall portfolio performance. Comparing your portfolio against the cap-weighted index is the starting point for thinking about risk and active return.
Angle 3: Layer Other Indices to See Structure
Cap weighting concentrates exposure in a few large names and dominant sectors. For a fuller picture, pair it with equal-weight indices (which capture small- and mid-cap moves) and sector indices (which isolate specific industries). The combination smooths out the structural bias inherent in cap weighting.
7. FAQ: Capitalization-Weighted Indices
Q1. Why do major funds use cap-weighted indices as their benchmark?
Because the methodology lines up naturally with how capital actually flows. Cap weighting mirrors where investors have put their money, which is the most sensible yardstick for "market performance." ETFs and index funds adopt the same construction to keep tracking error low and replication straightforward.
Q2. Is cap weighting "fair" to all companies?
Not entirely. Mega-caps dominate, and small-cap signals are largely absorbed into the noise of the broader index. Investors who want to read mid- and small-cap behavior typically layer in equal-weight or sector indices alongside cap-weighted benchmarks.
Q3. Which is "right"—cap-weighted or price-weighted?
Neither is universally correct; they serve different goals. Cap weighting is better for capturing overall market structure, while price weighting (Nikkei 225, DJIA) survives as a simple, historically continuous benchmark. For broad market reads, use cap-weighted; for following those specific legacy series, price-weighted is fine.
Q4. Why are the S&P 500 and TOPIX cap-weighted, while the Nikkei 225 and Dow are price-weighted?
Mostly historical sequencing. The Nikkei 225 and Dow were designed in earlier eras when price-weighting was the simplest practical choice. The S&P 500 (expanded in 1957) and TOPIX (launched in 1969) were designed later with broader market representation in mind, so they used cap-weighting. Today, cap-weighting is the global standard.
Q5. How should retail investors actually use cap-weighted indices?
Put them at the core of a core-satellite allocation. Use S&P 500, TOPIX, or MSCI World as your long-term core, and layer in equal-weight ETFs, sector ETFs, and thematic vehicles as satellites. This captures benchmark-like performance while compensating for the structural concentration that cap weighting tends to create.
8. Summary
A capitalization-weighted index is the most representative single number for modern equity markets: it tracks how investor capital is actually distributed across listed companies, and it is the benchmark of choice for the global fund and ETF universe.
Mega-cap concentration and sector skew are real structural weaknesses, but they do not displace cap weighting from its role as the default benchmark. Understanding both the math and the structural bias—and pairing it with price-weighted or equal-weight indices when appropriate—lets investors read the market more precisely and design more diversified, resilient portfolios.
S&P 500 Deep DiveFurther Reading
- What is a stock index? The basics of the headline benchmarks
- S&P 500 (US500) explained
- Nikkei 225 (JPN225) explained
- Monetary policy: the central bank toolkit and market transmission
- Black swan event: rare shocks and their market impact
Titan FX Research and Review Team — covering forex (FX), commodities (oil, precious metals, agricultural products), stock indices, US equities, and crypto assets, producing educational content for retail and institutional investors.
Primary Sources by Category
- Official data and regulators: S&P Dow Jones Indices methodology; Tokyo Stock Exchange "TOPIX Index Series Rules"; MSCI Index Methodology Handbook; FTSE Russell Global Equity Index Series Ground Rules.
- Market data and liquidity: Bloomberg Markets; Reuters; World Federation of Exchanges (WFE) Annual Statistics; Bank for International Settlements (BIS) Triennial Survey.
- Academic research: William F. Sharpe, "Capital Asset Prices" (Journal of Finance, 1964); Fama and French, "The Cross-Section of Expected Stock Returns"; Burton G. Malkiel, "A Random Walk Down Wall Street".
- Industry and third-party references: Investopedia (Market-Capitalization-Weighted Index); Vanguard Research; BlackRock iShares; Titan FX Research instrument pages.