RSI with adaptive response speed based on volatility (Titan_AdaptiveRSI)
Indicator Overview
RSI Adjusted to Match Market Momentum
This indicator is an enhanced version of the well‑known oscillator RSI, designed to adjust its reaction speed based on market volatility.
When market volatility is high and price moves quickly, it responds rapidly like a short‑term RSI.
When the market is calm, it moves more slowly.
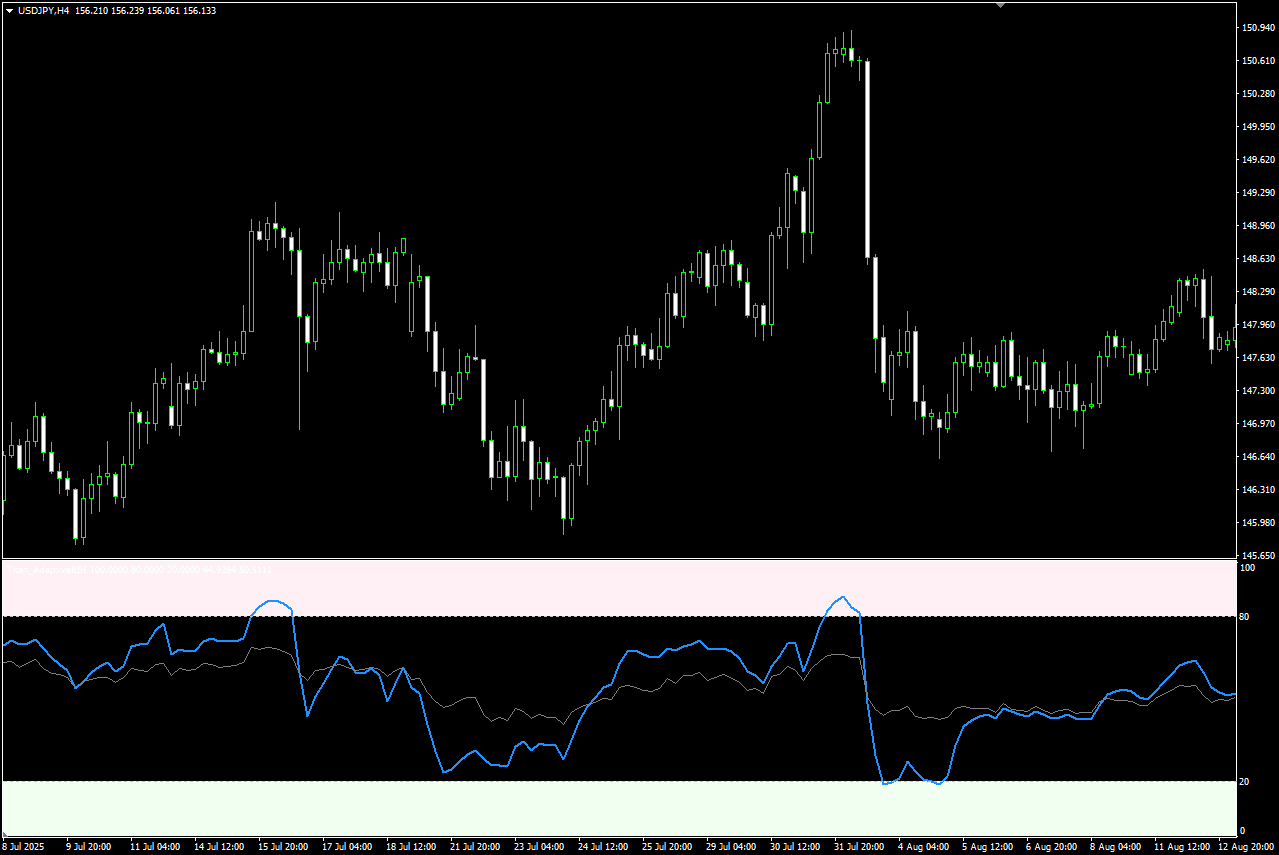
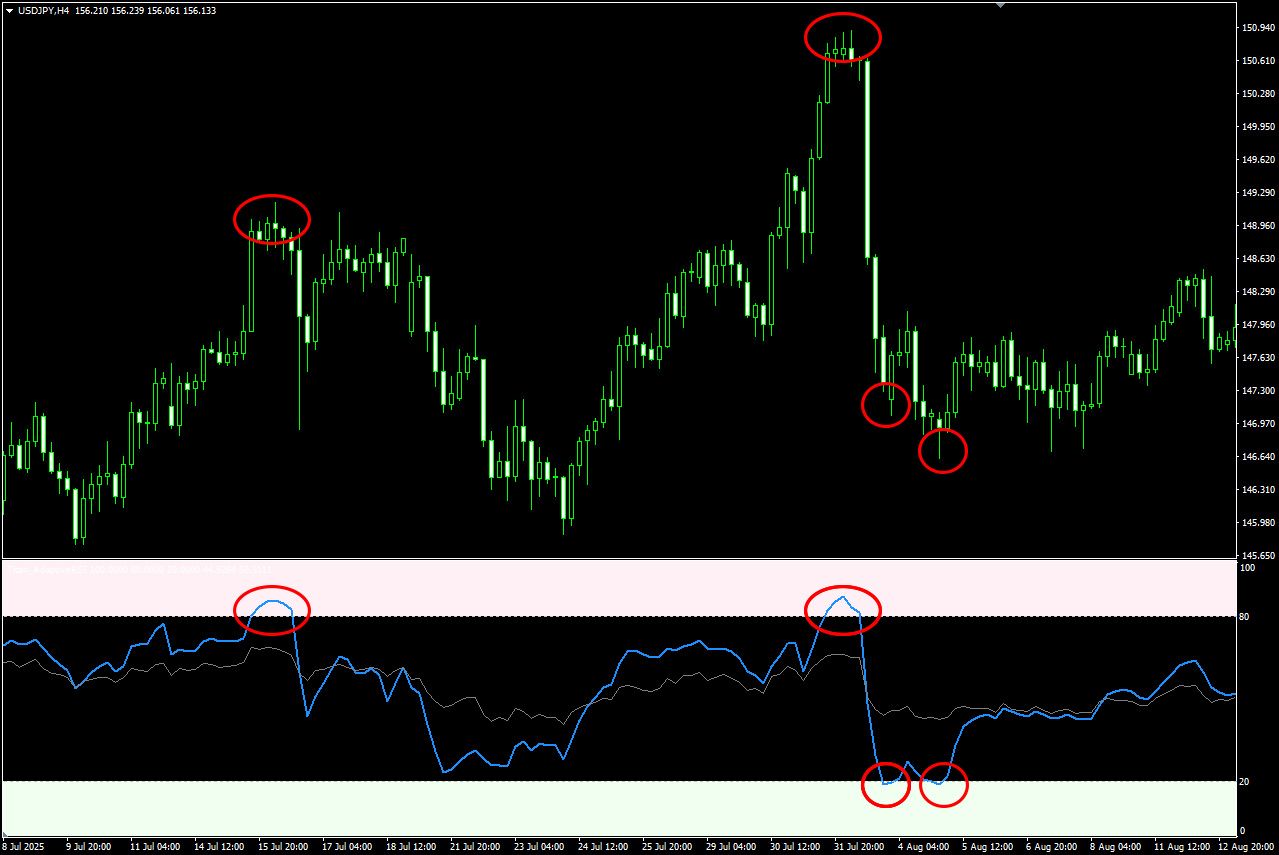
This helps reduce false signals while still allowing the indicator to be used as a tool—just like the standard RSI—to identify overbought/oversold conditions and timing for buying dips or selling rallies.
As with the standard RSI, values above 70 indicate overbought conditions and values below 30 indicate oversold conditions.
However, by setting these thresholds to 80 and 20, you can narrow the analysis to zones showing stronger levels of overheating.
Example with upper band set to 80 and lower band set to 20
This indicator works only on the Windows versions of TitanFX MT5 and MT4.
Indicator Terms of Use
Only those who agree to all the following items may use the indicators distributed on this website (https://research.titanfx.com):
1.The indicators and related descriptions are based on various data believed to be reliable, but their accuracy and completeness are not guaranteed.
2.The data displayed by the indicators do not guarantee your investment results. Also, the displayed content may vary due to market conditions and communication environments.
3.Please make investment decisions using indicators at your own risk. We are not responsible for any disadvantages or damages arising from the use of indicators.
4.Specifications of the indicators are subject to change without notice. Changes will be announced on the indicator description pages, etc.
5.Indicators should only be used by customers who have downloaded them. Transferring or selling the indicators to third parties is prohibited.
Indicator Settings
Input (for MT5) / Parameter Input (for MT4) Tab Items
| Variable Name | Description | Default |
|---|---|---|
| Min RSI Length | Sets the minimum value for the adaptive RSI. | 5 |
| Max RSI Length | Sets the maximum value for the adaptive RSI. | 30 |
| Volatility Method | Sets the method used to measure volatility. | ATR |
| Volatility Period | Sets the period for volatility measurement. | 20 |
| Sigmoid Coefficient k | Sets the coefficient for converting volatility measurement results into a 0–1 scale. | 1.5 |
| RSI Smoothing | Sets the value used to smooth the displayed line. | 3 |
| Output Normalization | Sets the method for normalizing the output. | none |
| Normalization Period | Sets the period when Z‑score is selected for output normalization. | 50 |
| Band Method | When percentile is selected, displays P20/P80 of the normalization period as background color. | fixed |
| Upper Band | Sets the upper threshold when “fixed” is selected for band method. | 70 |
| Lower Band | Sets the lower threshold when “fixed” is selected for band method. | 30 |
| Upper Band Color | Sets the background color for overbought zones. | LavenderBlush |
| Lower Band Color | Sets the background color for oversold zones. | Honeydew |
| Adaptive RSI Line Color | Sets the line color of the adaptive RSI. | DodgerBlue |
| RSI Line Color | Sets the line color of the standard RSI (period defined by “Maximum RSI Period”). | Gray |
| Maximum Bars | Sets the number of candlesticks on which the indicator is displayed. | 1000 |
Color (for MT5) / Color Settings (for MT4) Tab Items
Not used in this indicator.