Indicator that Displays CCI as a Histogram (Titan_CCI_ColorHistogram)
Display CCI as a Histogram
CCI (Commodity Channel Index) is an important technical indicator used to measure the strength of market trends and overbought/oversold conditions. However, it can sometimes be difficult to interpret using a standard line chart.
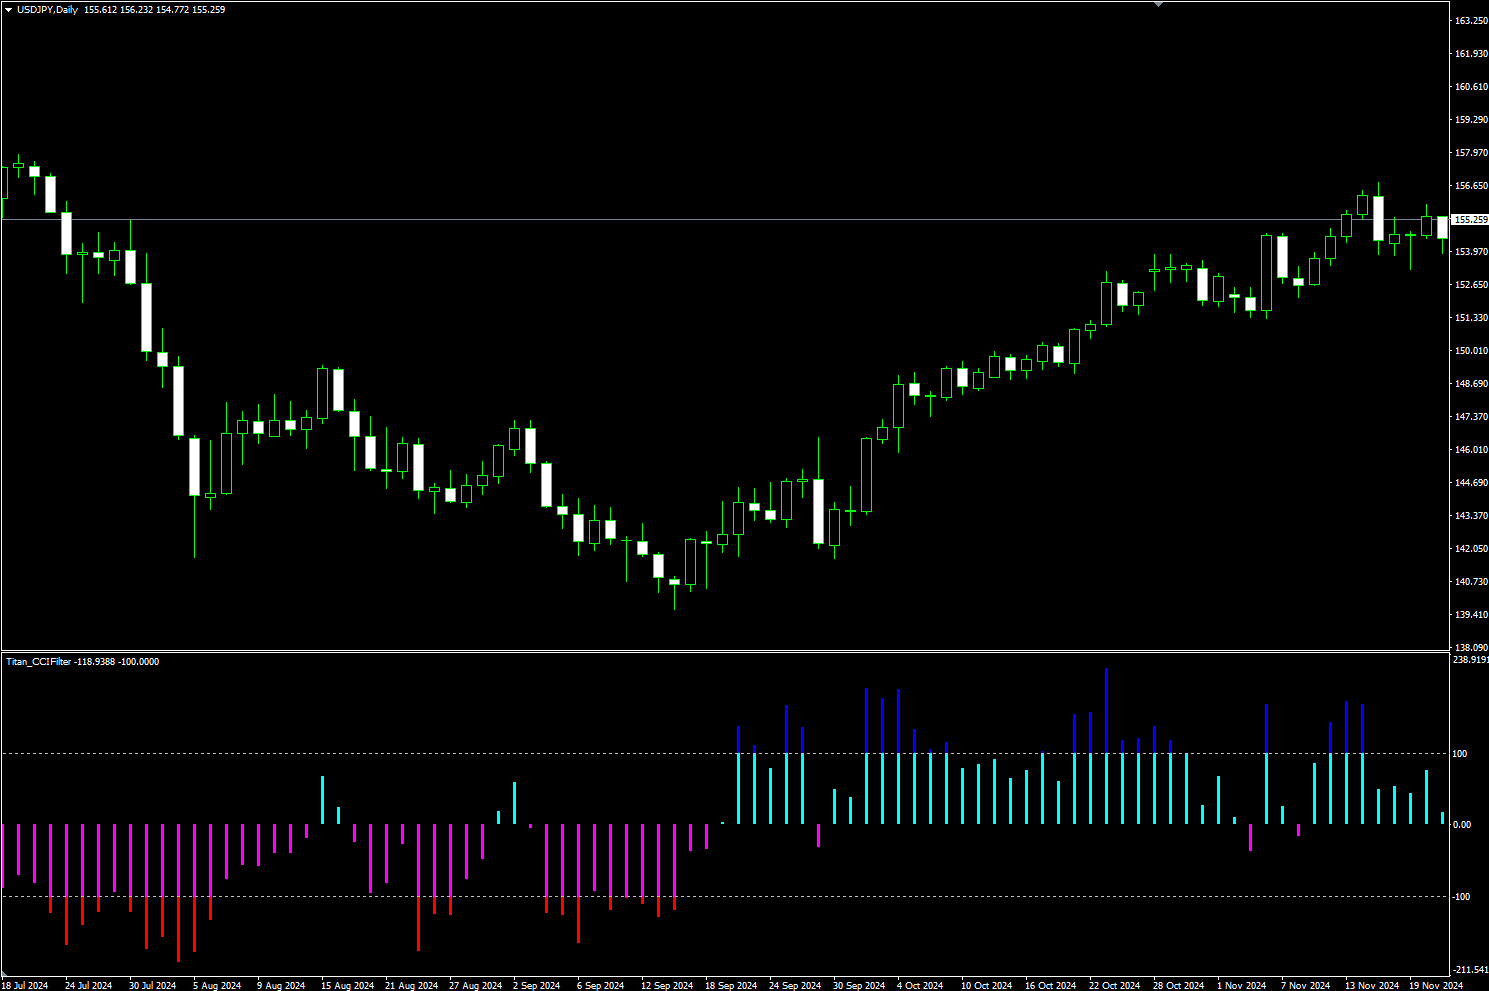
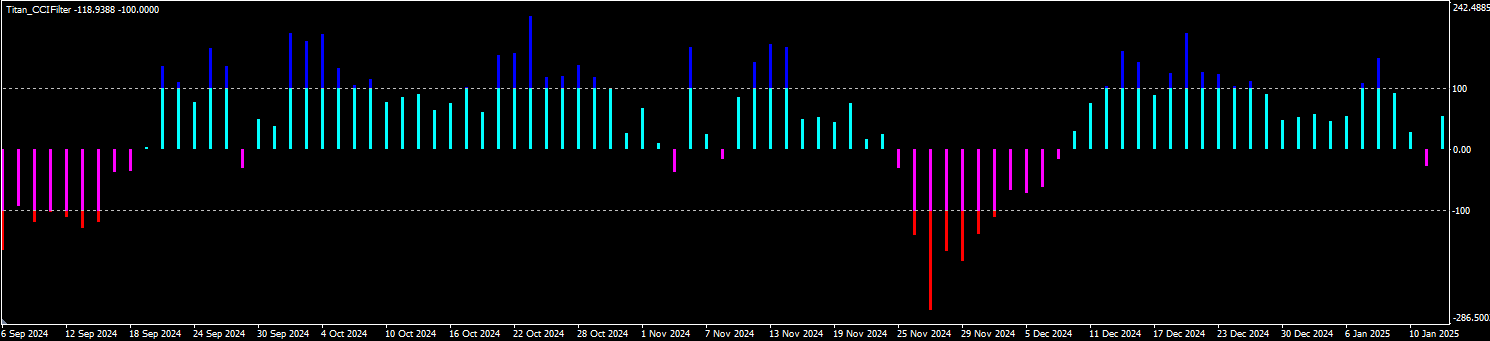
Titan_CCI_ColorHistogram is an indicator that displays CCI as a bar graph (histogram) and changes color when it exceeds a specified threshold, making it visually easier to understand.
By using this indicator, you can instantly assess CCI movements and more clearly determine entry and exit points.
For example, if the threshold is set to 100, the histogram color changes when the CCI value exceeds ±100, allowing you to capture the initial phase of a trend. Additionally, setting the threshold to 200 or higher enables you to visually identify overbought market conditions.
【Example Display of Titan_CCI_ColorHistogram】
※ This indicator is only compatible with the Windows versions of MT5 and MT4 for TitanFX.
Indicator Terms of Use
Only those who agree to all the following items may use the indicators distributed on this website (https://research.titanfx.com):
1.The indicators and related descriptions are based on various data believed to be reliable, but their accuracy and completeness are not guaranteed.
2.The data displayed by the indicators do not guarantee your investment results. Also, the displayed content may vary due to market conditions and communication environments.
3.Please make investment decisions using indicators at your own risk. We are not responsible for any disadvantages or damages arising from the use of indicators.
4.Specifications of the indicators are subject to change without notice. Changes will be announced on the indicator description pages, etc.
5.Indicators should only be used by customers who have downloaded them. Transferring or selling the indicators to third parties is prohibited.
Indicator Settings
Input Tab (for MT5) / Parameter Input Tab (for MT4) Settings
| Variable Name | Description | Default |
|---|---|---|
| Period | Specifies the period for calculating CCI. | 14 |
| Applied Price | Specifies the price used for CCI calculations. | Typical Price |
| Threshold | Specifies the threshold at which the graph color changes. If set to 100, the color changes at ±100. | 100 |
| Histogram Width | Specifies the thickness of the histogram. | 2 |
| Color (Positive, Exceeds Threshold) | Specifies the color when the CCI value is positive and exceeds the threshold. | Blue |
| Color (Positive, Below Threshold) | Specifies the color when the CCI value is positive but does not exceed the threshold. | Aqua |
| Color (Negative, Exceeds Threshold) | Specifies the color when the CCI value is negative and exceeds the threshold. | Red |
| Color (Negative, Below Threshold) | Specifies the color when the CCI value is negative but does not exceed the threshold. | Magenta |
Color Tab (for MT5) / Color Settings Tab (for MT4)
This indicator does not use this setting.