Indicator to draw candlesticks on the subchart (Titan_Candle_Draw)
Display candlesticks on the subchart
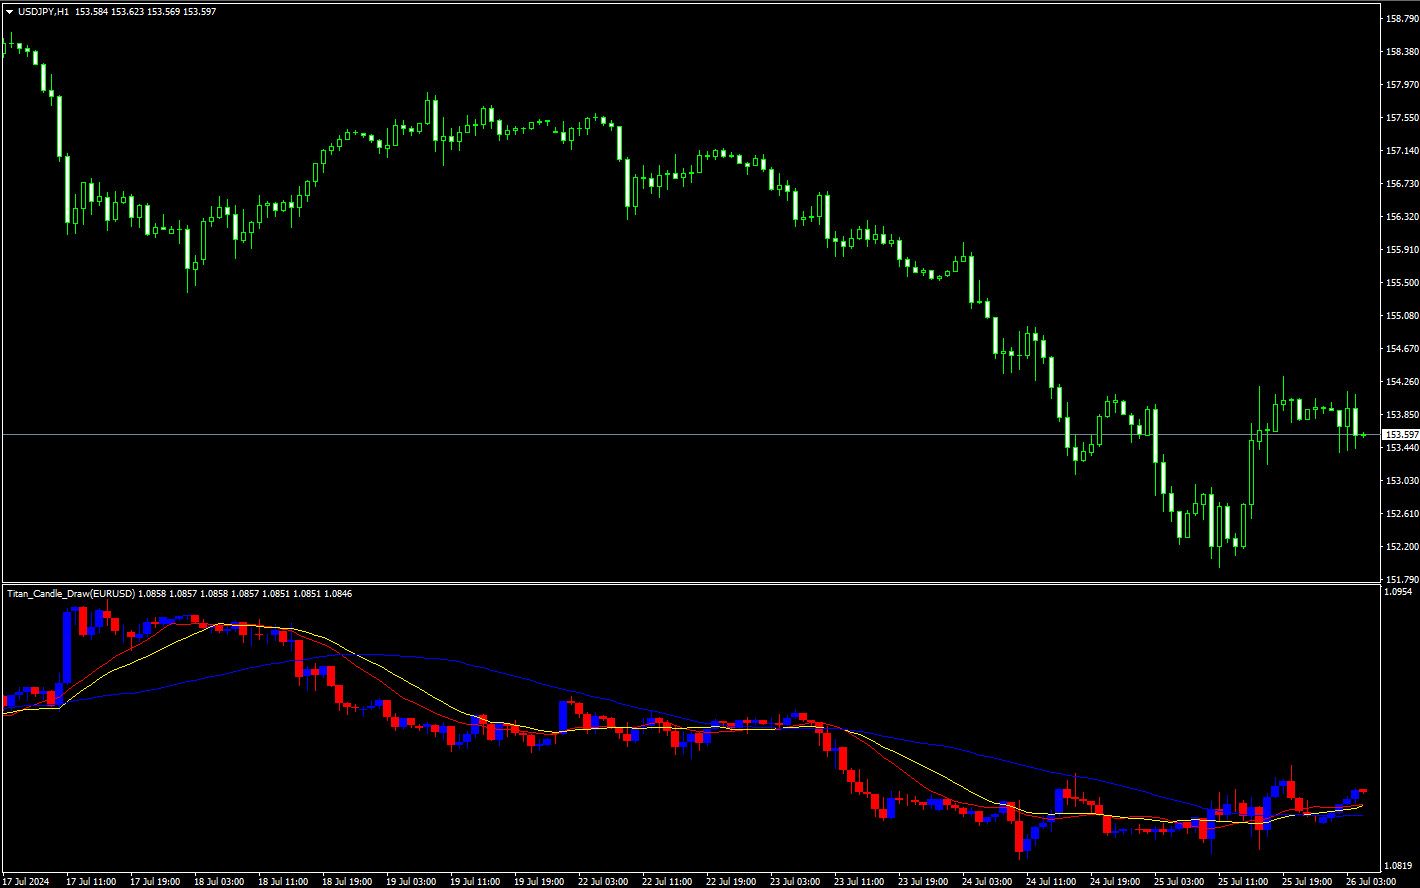
This indicator displays candlestick charts on the subchart. The candlesticks displayed can be those of the same symbol shown on the chart, as well as those of different symbols, and even those of higher timeframes.
By overlaying the price movements of other symbols or timeframes, you can perform advanced analysis more efficiently.
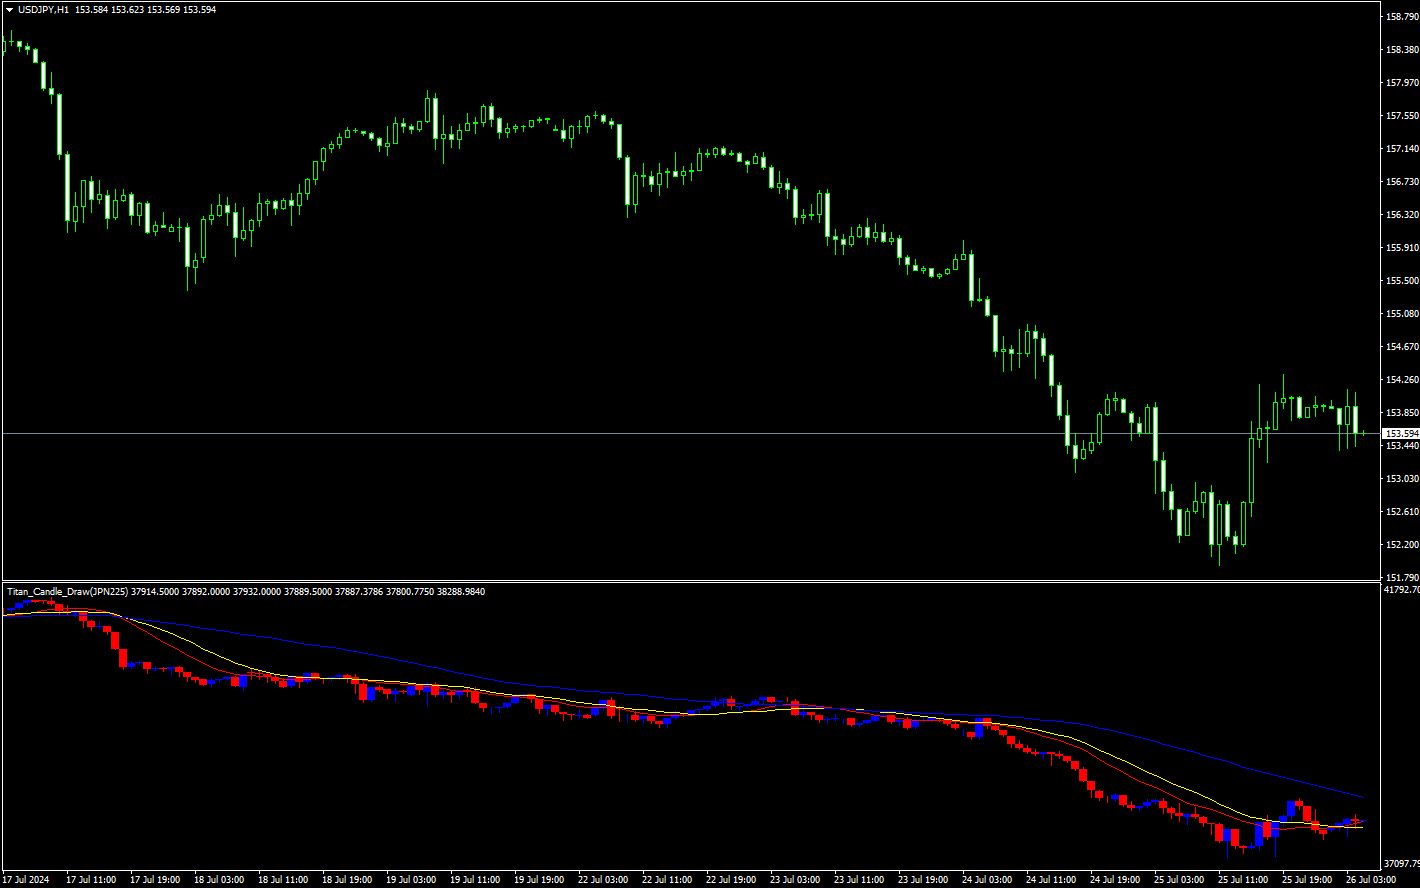
[Example of displaying JPN225 on a USDJPY 1-hour chart]
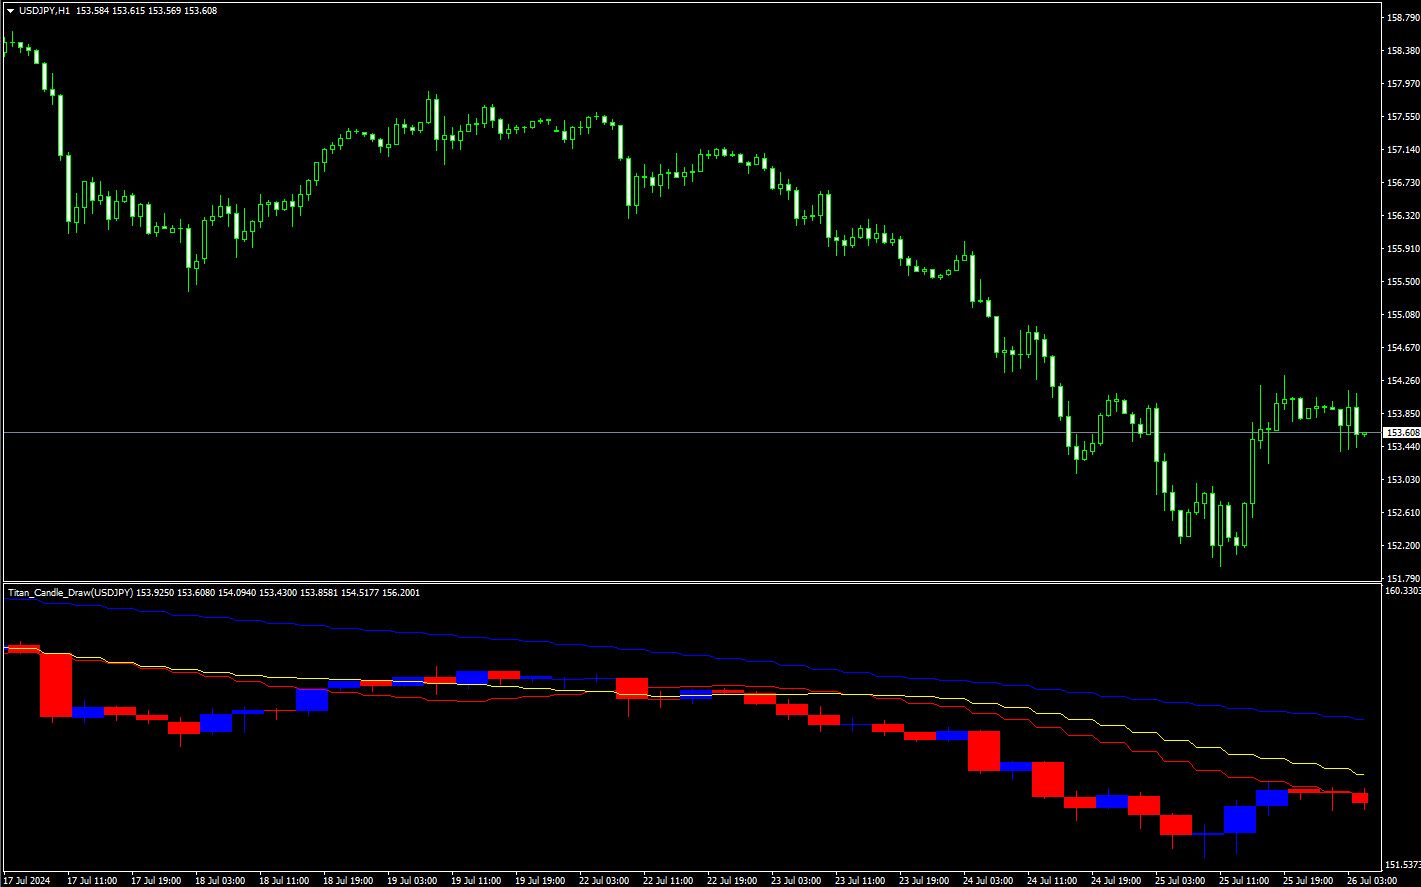
[Example of displaying 4-hour candlesticks on a USDJPY 1-hour chart]
*This indicator only works on the Windows version of TitanFX's MT5 and MT4. *If the candlesticks do not display correctly due to the subchart's price data not loading properly, try switching the timeframe to reload the data.
Indicator Terms of Use
Only those who agree to all the following items may use the indicators distributed on this website (https://research.titanfx.com):
1.The indicators and related descriptions are based on various data believed to be reliable, but their accuracy and completeness are not guaranteed.
2.The data displayed by the indicators do not guarantee your investment results. Also, the displayed content may vary due to market conditions and communication environments.
3.Please make investment decisions using indicators at your own risk. We are not responsible for any disadvantages or damages arising from the use of indicators.
4.Specifications of the indicators are subject to change without notice. Changes will be announced on the indicator description pages, etc.
5.Indicators should only be used by customers who have downloaded them. Transferring or selling the indicators to third parties is prohibited.
Indicator settings
Settings in the Inputs (for MT5) or Parameters (for MT4) tab
| Variable Name | Description | Default |
|---|---|---|
| Timeframe | Specifies the timeframe of the candlesticks to display. Selecting 'current' will use the timeframe of the displayed chart. | current |
| Symbol | Specifies the symbol. | - |
| Bullish Candle Color | Specifies the color of bullish candlesticks. | Blue |
| Bearish Candle Color | Specifies the color of bearish candlesticks. | Red |
| Moving Averages 1-3 | Specifies whether to display moving averages. Select 'true' to display and 'false' to hide. | true |
| Period | Specifies the period of each moving average. | 14, 20, 50 |
| Type | Specifies the type of each moving average. | Simple(SMA) |
| Shift | Specifies the number of bars to shift the moving average display if desired. | 0 |
| Apply to Price | Specifies the type of price used to calculate each moving average. | Close price |
| Line Color | Specifies the color of each moving average line. | Red, Yellow, Blue |
| Line Type | Specifies the style of each moving average line. | Solid |
| Line Width | Specifies the width of each moving average line. | 1 |
Settings in the Colors (for MT5) or Color Settings (for MT4) tab
Not used in this indicator.