An indicator that displays trends for each timeframe as a heatmap (Titan_DMI_Monitor).
Displaying Trends for Each Period and Timeframe as a Heatmap Based on DMI Values
In FX trading, determining the strength of a trend is one of the key factors.
This indicator uses the values of +DI and -DI from the DMI (Directional Movement Index) to display the strength of trends across multiple timeframes.
You can check the momentum of short-term, medium-term, and long-term trends.
How to Interpret the Indicator
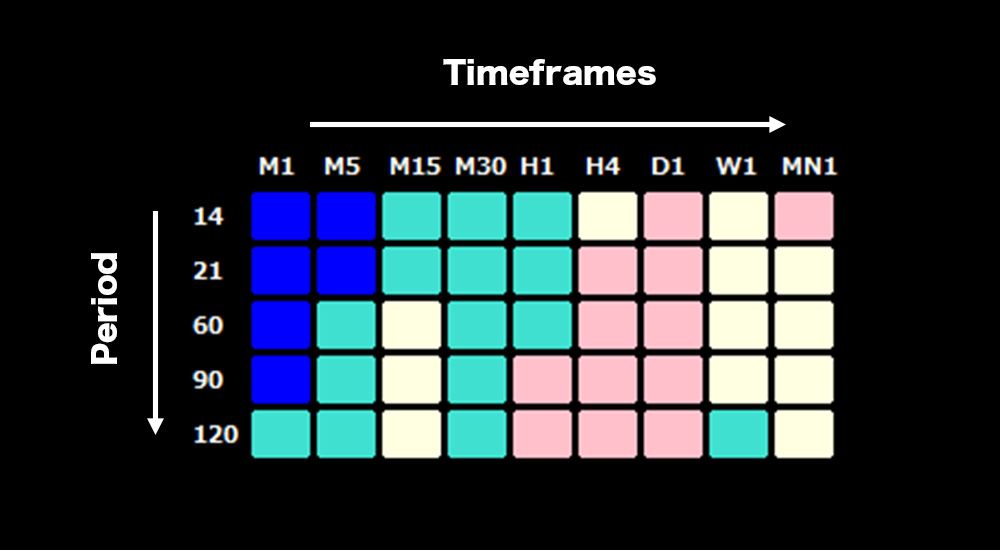
From left to right, the indicator displays the strength of trends for the 1-minute, 5-minute, 15-minute, 30-minute, 1-hour, 4-hour, daily, weekly, and monthly timeframes. It also shows data for five different specified periods vertically.
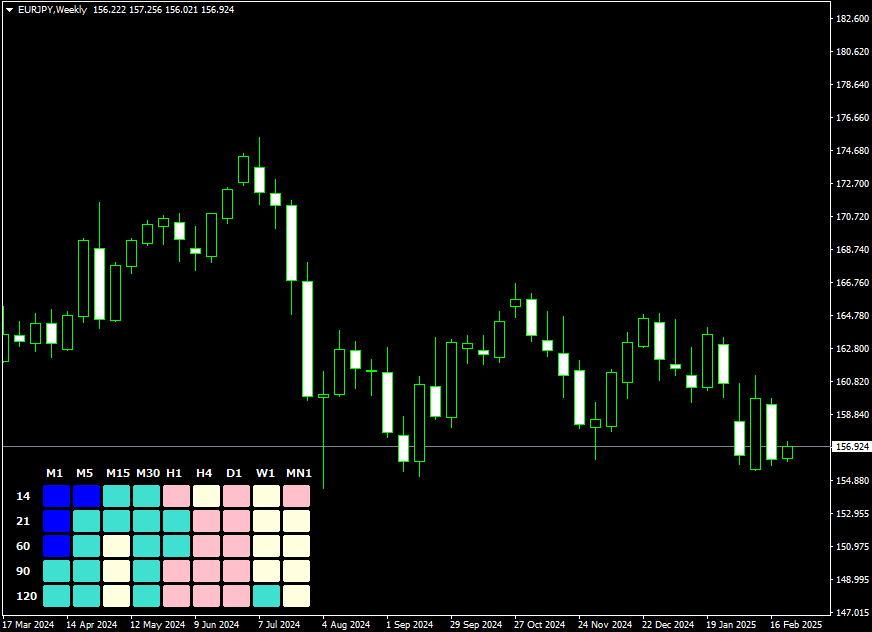
【Example of Indicator Display】
※This indicator is compatible only with the Windows versions of MT5 and MT4 from TitanFX.
Indicator Terms of Use
Only those who agree to all the following items may use the indicators distributed on this website (https://research.titanfx.com):
1.The indicators and related descriptions are based on various data believed to be reliable, but their accuracy and completeness are not guaranteed.
2.The data displayed by the indicators do not guarantee your investment results. Also, the displayed content may vary due to market conditions and communication environments.
3.Please make investment decisions using indicators at your own risk. We are not responsible for any disadvantages or damages arising from the use of indicators.
4.Specifications of the indicators are subject to change without notice. Changes will be announced on the indicator description pages, etc.
5.Indicators should only be used by customers who have downloaded them. Transferring or selling the indicators to third parties is prohibited.
Indicator Settings
Settings in the "Inputs" Tab (for MT5) / "Parameter Input" Tab (for MT4)
| Variable Name | Description | Default |
|---|---|---|
| Period 1–5 | Specifies the DMI periods to be displayed. | 14, 21, 60, 90, 120 |
| Display Position | Selects the display position from the bottom left or top left. | Bottom Left |
| Text Color | Specifies the color of the displayed text. | White |
| Strong Uptrend Color | Specifies the color displayed during a strong uptrend. | Blue |
| Weak Uptrend Color | Specifies the color displayed during a weak uptrend. | Turquoise |
| No Trend Color | Specifies the color displayed when there is no trend. | LightYellow |
| Weak Downtrend Color | Specifies the color displayed during a weak downtrend. | Pink |
| Strong Downtrend Color | Specifies the color displayed during a strong downtrend. | Red |
Settings in the "Colors" Tab (for MT5) / "Color Settings" Tab (for MT4)
This indicator does not use this setting.