Indicator Showing the Thickness of the Ichimoku Cloud (Titan_Ichimoku_Cloud_Thickness)
Indicator Overview
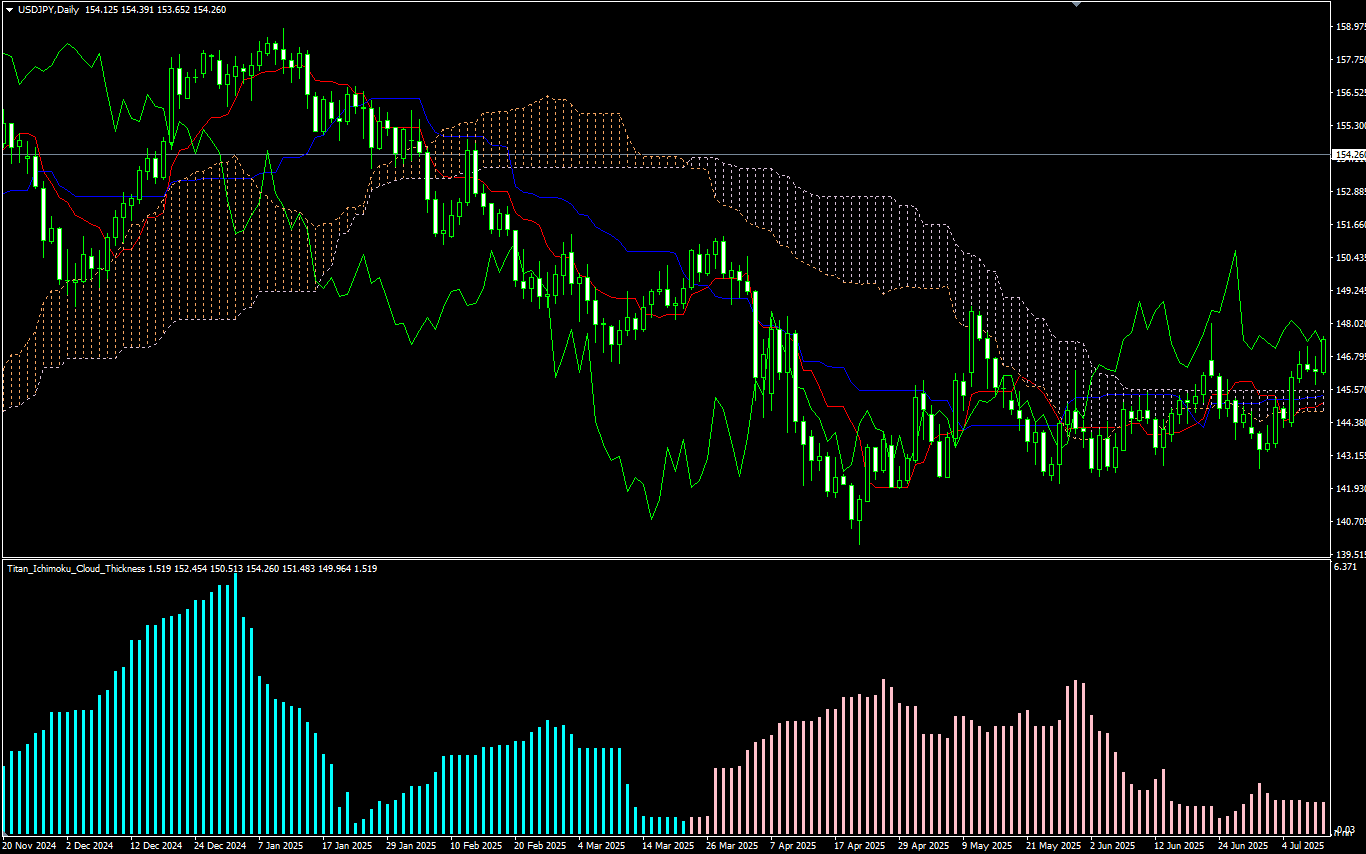
Displaying Ichimoku Cloud Thickness as a Histogram
The Ichimoku Kinko Hyo is a representative technical indicator originating from Japan, and the “cloud” (area between the leading spans) is an essential element for visually grasping market momentum and potential reversals.
In the standard Ichimoku indicator, the thickness of the cloud is judged visually based on the “area size,” but it can be difficult to assess quantitatively. This indicator visualizes the cloud thickness in a histogram within a subwindow, making it easier to identify the strength of a trend or signs of a reversal.
The color of the histogram is displayed as light blue (default) when Leading Span A is above (indicating a strong upward trend), and pink (default) when Leading Span A is below (indicating a strong downward trend).
How to Analyze Using This Indicator
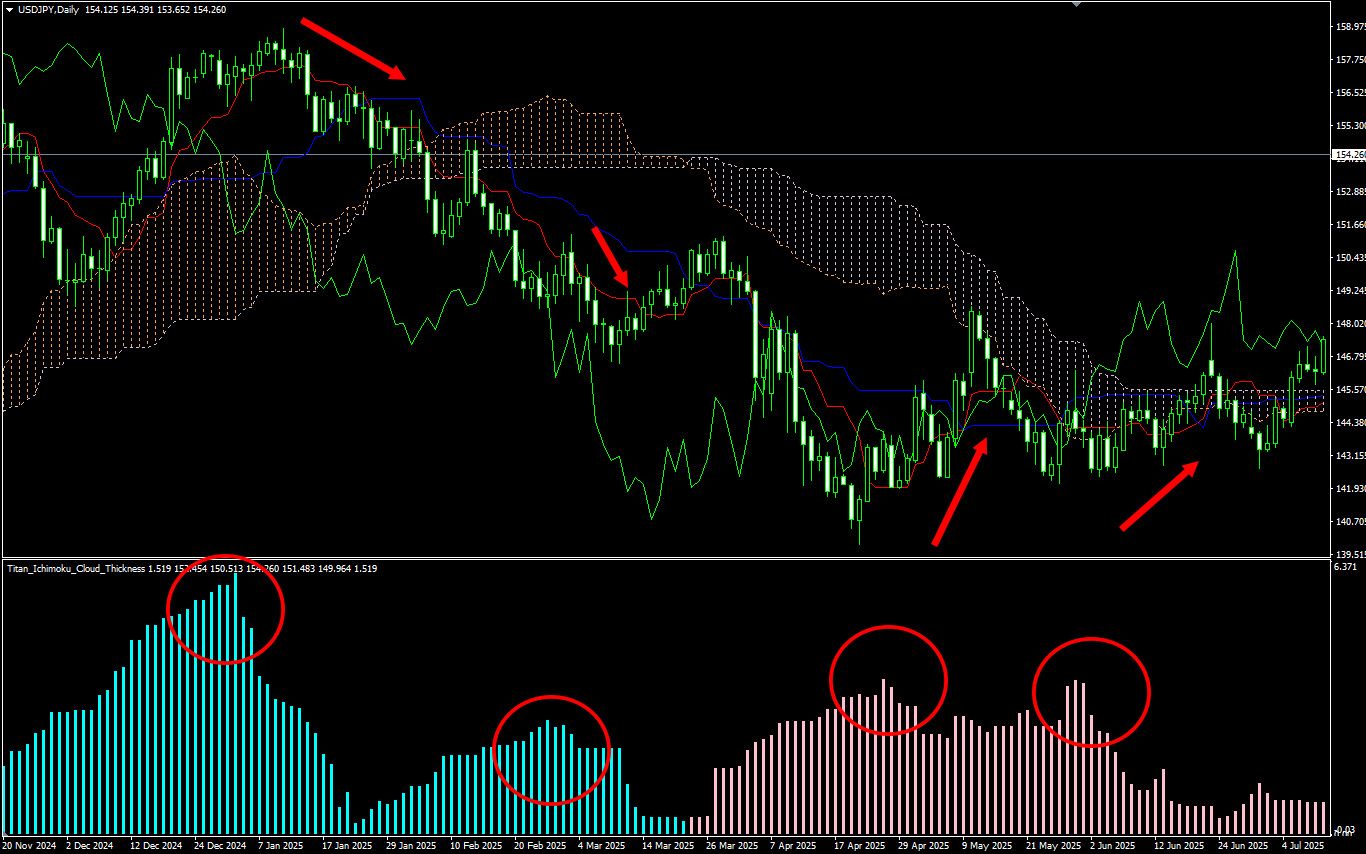
The thickness of the Ichimoku cloud indicates the strength of the trend. A thick cloud suggests a strong trend. On the other hand, when the cloud thickness appears to be peaking, it may indicate a consolidation or a potential trend change, so if you're profiting from a trend-following strategy, it may be time to consider taking profits.
Additionally, when the cloud shows a twisting movement, it suggests market indecision and a heightened possibility of a trend reversal. In such situations, extra caution is advised. You may look for entry points targeting a trend reversal or review your existing positions.
[Example focusing on a peak-out of cloud thickness (The Ichimoku Cloud itself is not displayed in this indicator.)]
This indicator works only with the Windows versions of MT5 and MT4 provided by TitanFX.
Indicator Terms of Use
Only those who agree to all the following items may use the indicators distributed on this website (https://research.titanfx.com):
1.The indicators and related descriptions are based on various data believed to be reliable, but their accuracy and completeness are not guaranteed.
2.The data displayed by the indicators do not guarantee your investment results. Also, the displayed content may vary due to market conditions and communication environments.
3.Please make investment decisions using indicators at your own risk. We are not responsible for any disadvantages or damages arising from the use of indicators.
4.Specifications of the indicators are subject to change without notice. Changes will be announced on the indicator description pages, etc.
5.Indicators should only be used by customers who have downloaded them. Transferring or selling the indicators to third parties is prohibited.
Indicator Settings
Input Tab (for MT5), Parameter Input Tab (for MT4)
| Variable Name | Description | Default |
|---|---|---|
| Conversion Line Period | Specifies the period for calculating the conversion line. | 9 |
| Base Line Period | Specifies the period for calculating the base line. | 26 |
| Leading Span B Period | Specifies the period for calculating the leading span. | 52 |
Color Tab (for MT5), Color Settings Tab (for MT4)
| Variable Name | Description | Default |
|---|---|---|
| 0 | Specifies the color and thickness of the histogram when Leading Span A is above. | Aqua |
| 1 | Specifies the color and thickness of the histogram when Leading Span A is below. | Pink |