Indicator for Visualizing Market Overextension (Titan_MarketExhaustionMeter)
Indicator Overview
Check for "Overextended" Market Conditions
One common mistake in trading is entering a position after the market has already made a significant move.
When prices rise sharply, it’s easy to feel that “it will keep going,” which often leads to buying at the top.
This indicator helps prevent such misjudgments by visualizing how overextended the price is in numerical terms.
While typical indicators show the "direction of the trend," this indicator allows you to assess whether "the current move is overextended."
Mechanism for Quantifying Market Exhaustion
First, it measures how far the current price is from the moving average (EMA). Then, by dividing that value by the ATR (average price movement range), it calculates the market's "exhaustion level."
In other words, it represents "how abnormally far the price has deviated compared to its usual movement" as a numerical value.
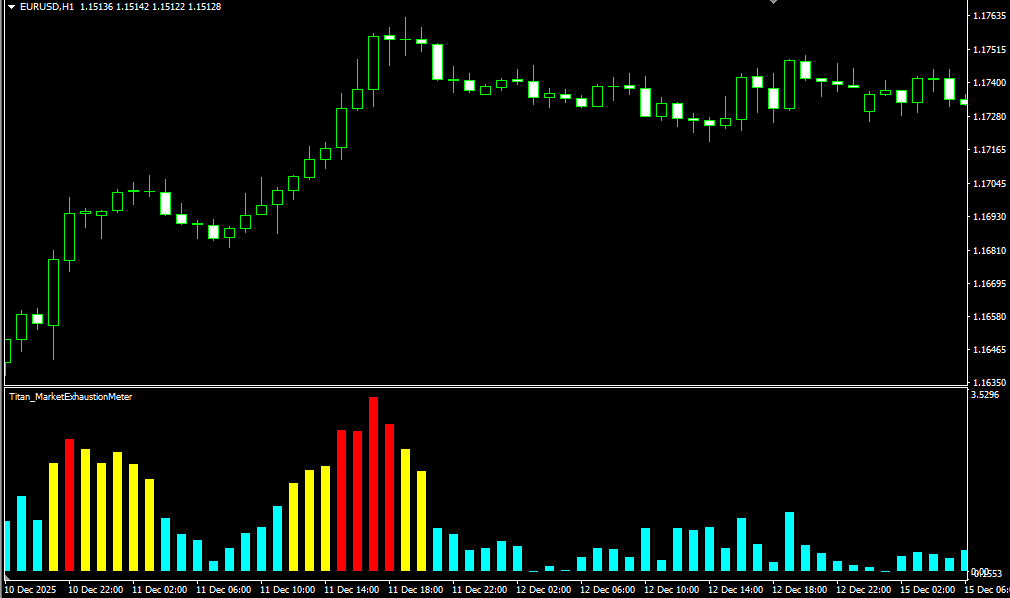
The display is shown as a histogram in a sub-chart, with colors changing according to the magnitude of the value. As price movement increases, it becomes visually emphasized, allowing you to instantly recognize an "overextended" condition.
How to Use This Indicator
A Tool to Help Avoid Forced Entries
This indicator does not directly signal entry timing. Instead, it supports the decision of "whether you should refrain from entering at this moment."
Practical Usage Example
For example, if the price rises significantly and the indicator shows an "overextended" condition, there is a possibility that the movement will temporarily settle (enter a correction phase).
Chasing the market in such situations increases the risk of the price moving in the opposite direction immediately after entry.
On the other hand, if the price movement is still calm, it may indicate the early stage of a trend.
By checking "where the current price stands" before entering, you can make more composed decisions.
A Tool to Reduce Trading Frequency
This indicator is not designed to increase the number of trades. Rather, it is a tool to reduce unnecessary trades.
Especially for beginners, the fear of missing out often leads to jumping into an already moving market.
By using the Market Exhaustion Meter, you can recognize when "the market has already moved too much", making it easier to avoid forced entries.
Improved Accuracy with Other Indicators
While this indicator is effective on its own, combining it with other technical indicators or support and resistance analysis can lead to more accurate trading decisions.
This indicator works only on the Windows version of MT5 and MT4 provided by TitanFX.
Indicator Terms of Use
Only those who agree to all the following items may use the indicators distributed on this website (https://research.titanfx.com):
1.The indicators and related descriptions are based on various data believed to be reliable, but their accuracy and completeness are not guaranteed.
2.The data displayed by the indicators do not guarantee your investment results. Also, the displayed content may vary due to market conditions and communication environments.
3.Please make investment decisions using indicators at your own risk. We are not responsible for any disadvantages or damages arising from the use of indicators.
4.Specifications of the indicators are subject to change without notice. Changes will be announced on the indicator description pages, etc.
5.Indicators should only be used by customers who have downloaded them. Transferring or selling the indicators to third parties is prohibited.
Indicator Settings
Input (for MT5), Parameter Input (for MT4) Tab Settings
| Variable Name | Description | Default |
|---|---|---|
| EMA Period | Specifies the EMA period used as the basis for calculation. | 14 |
| ATR Period | Specifies the ATR period used as the basis for calculation. | 14 |
| Stretch Threshold | Threshold used to determine when deviation from the moving average is beginning to increase. | 1.5 |
| Exhaustion Threshold | Threshold used to determine when deviation from the moving average is large. | 2.5 |
| Lookback Bars | Specifies the number of bars on which the indicator is displayed. | 3000 |
Color (for MT5), Color Settings (for MT4) Tab Settings
| MT5 Variable Name | MT4 Variable Name | Description |
|---|---|---|
| 0 | 0 | Graph color, thickness, and style when deviation is small |
| 1 | 1 | Graph color, thickness, and style when deviation begins to appear |
| 2 | 2 | Graph color, thickness, and style when deviation becomes large |