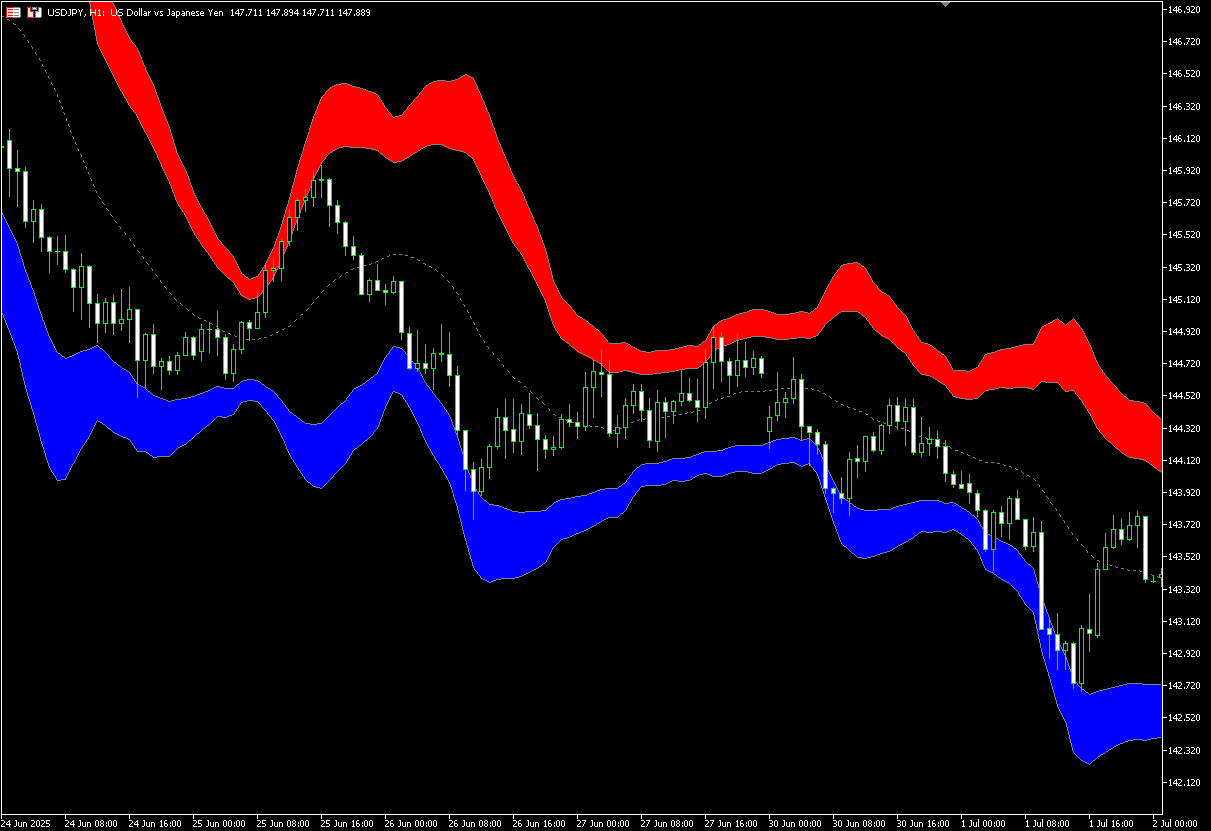
Highlights the ±2σ to ±3σ range of Bollinger Bands (Titan_Overshoot)
Indicator Overview
Bollinger Bands and Market "Overheating"
Bollinger Bands are an indicator that visualizes the range of market fluctuations using the standard deviation (σ) of prices.
[What Bollinger Bands Display]
- Center Line: Moving Average (typically 20SMA)
- ±1σ: Range where the price stays with 68.2% probability
- ±2σ: Range where the price stays with 95.4% probability
- ±3σ: Range where the price stays with 99.7% probability
In general, when prices reach the ±2σ to ±3σ range, it is considered a “statistically abnormal” level and viewed as a sign of "overheating" or "excessive movement" in the market.
If the price frequently stays in this area, reaching +2σ to +3σ during an uptrend may indicate a short-term overbought (peak) condition, while reaching -2σ to -3σ during a downtrend may indicate a short-term oversold (bottom) condition.
These signals can be important for identifying contrarian trading opportunities aiming for market reversals or corrections.
Automatically Fill Between ±2σ and ±3σ to Visualize Overheating
This indicator automatically fills the area between ±2σ and ±3σ of the Bollinger Bands.
By visually highlighting the “overheated area,” which is often difficult to detect with standard band displays, it allows traders to easily grasp the market's overheating conditions and monitor them efficiently.
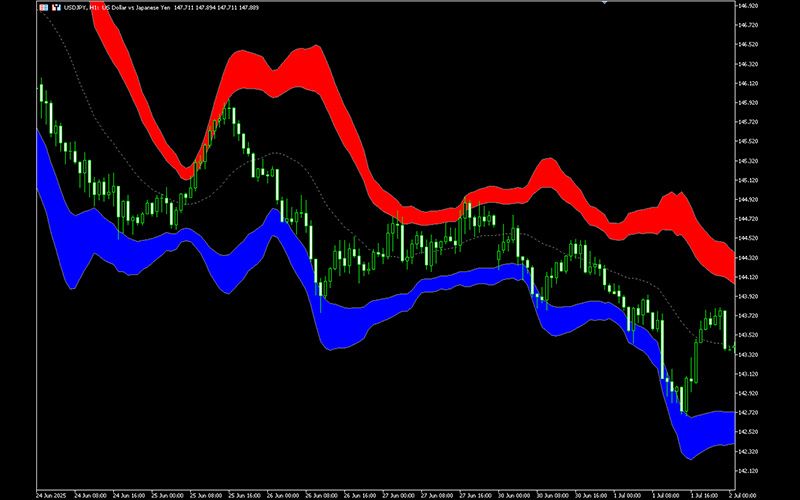
[Example of Indicator Display]
How to Use This Indicator
Supporting Profit Taking and Contrarian Strategies
When the price moves within the 2σ to 3σ zone, it suggests a potential short-term market overheating. In such cases, you may consider taking profits on existing positions or entering contrarian trades.
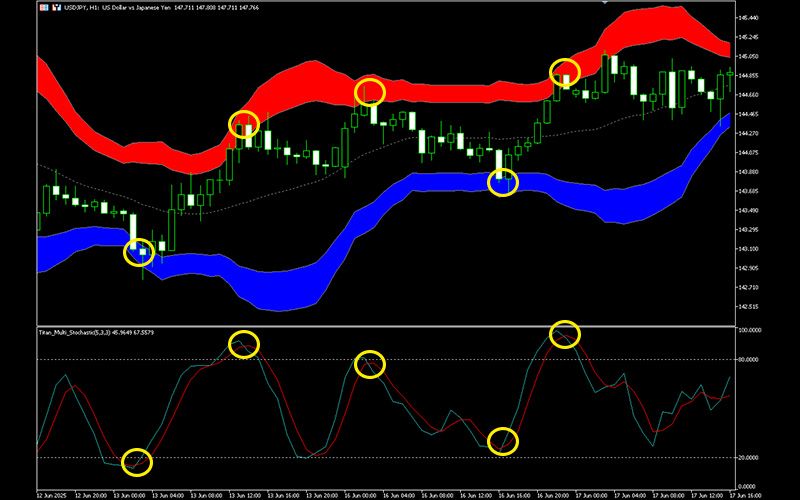
Using it alongside oscillators like RSI or Stochastics can help improve timing accuracy for entries.
[Example of Analysis Using Stochastics]
Trend Analysis
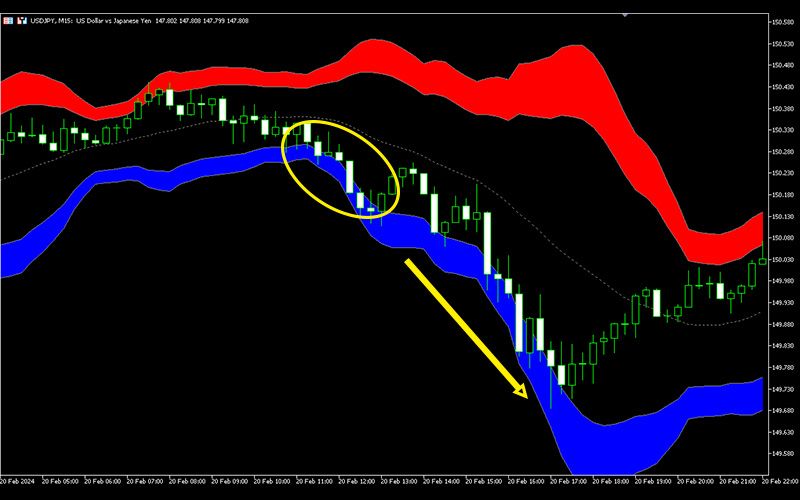
If the price continues to stay within the 2σ to 3σ range during an uptrend, it indicates a strong trend and increases the likelihood of a long-term trend continuation. If the price enters this zone but doesn't reverse, consider looking for pullbacks and implementing a trend-following strategy.
[Example of Development into a Long-Term Trend]
This indicator is only available on the Windows versions of MT5 and MT4 provided by TitanFX.
Indicator Terms of Use
Only those who agree to all the following items may use the indicators distributed on this website (https://research.titanfx.com):
1.The indicators and related descriptions are based on various data believed to be reliable, but their accuracy and completeness are not guaranteed.
2.The data displayed by the indicators do not guarantee your investment results. Also, the displayed content may vary due to market conditions and communication environments.
3.Please make investment decisions using indicators at your own risk. We are not responsible for any disadvantages or damages arising from the use of indicators.
4.Specifications of the indicators are subject to change without notice. Changes will be announced on the indicator description pages, etc.
5.Indicators should only be used by customers who have downloaded them. Transferring or selling the indicators to third parties is prohibited.
Indicator Settings
Input (MT5) / Parameter Input (MT4) Tab Settings
| Variable Name | Description | Default |
|---|---|---|
| Period | Specifies the period for the Bollinger Bands. | 20 |
| Show Center Line | Specifies whether to display the center line (moving average). | true |
| Show SD1 | Specifies whether to display ±1σ of the Bollinger Bands. | false |
| Show SD2 | Specifies whether to display ±2σ of the Bollinger Bands. | true |
| Show SD3 | Specifies whether to display ±3σ of the Bollinger Bands. | true |
| Upper Zone Color | Specifies the fill color between +2σ and +3σ. | Red |
| Lower Zone Color | Specifies the fill color between -2σ and -3σ. | Blue |
Color (MT5) / Color Settings (MT4) Tab Settings
You can specify line thickness and type, but color settings should be configured in the Input (MT5) or Parameter Input (MT4) tab.