Histogram Indicator Showing the Difference Between Price and Moving Average (Titan_Price_MA_Diff)
Displaying the Difference Between Price and Moving Average
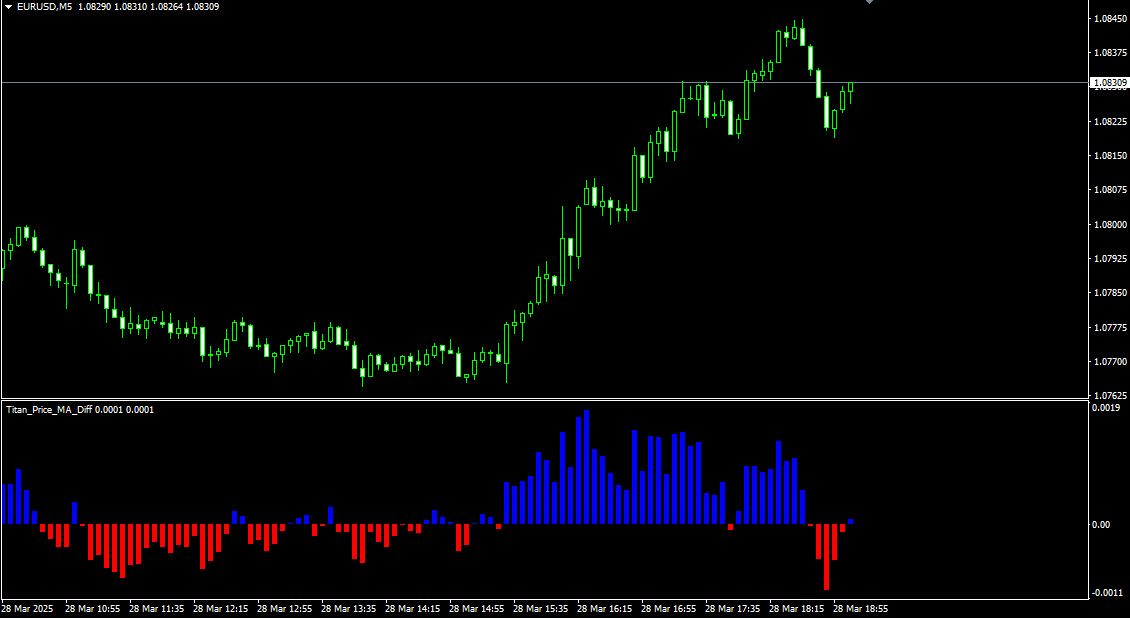
This indicator displays the difference between the price and the moving average as a histogram (bar chart).
The moving average is one of the most widely used tools in FX and CFD chart analysis.
By analyzing the divergence between the price and the moving average, traders can quickly identify potential trend formations or signs of an overheated trend.
It can also be useful for identifying buy-on-dip or sell-on-rally opportunities during trading.
Identifying Potential Trend Formations
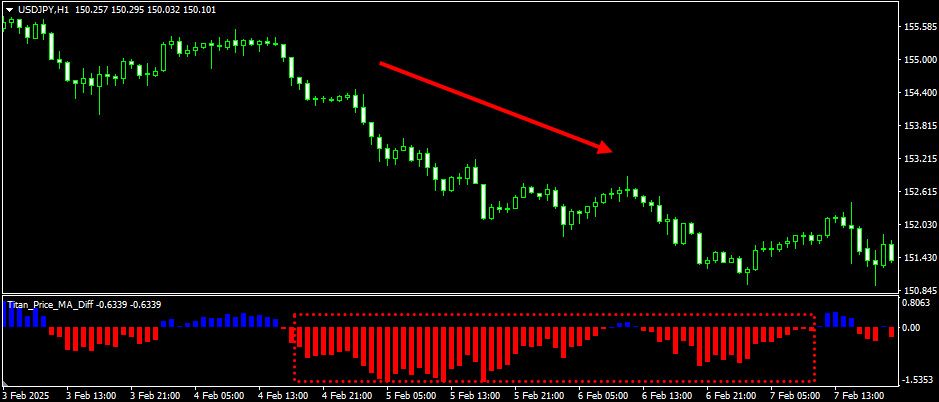
When a trend is forming, the divergence between the price and the moving average tends to widen.
If the divergence becomes larger compared to a ranging market, it may indicate a higher likelihood of a trend developing.
【Example of Trend Formation】
Identifying Trend Overheating
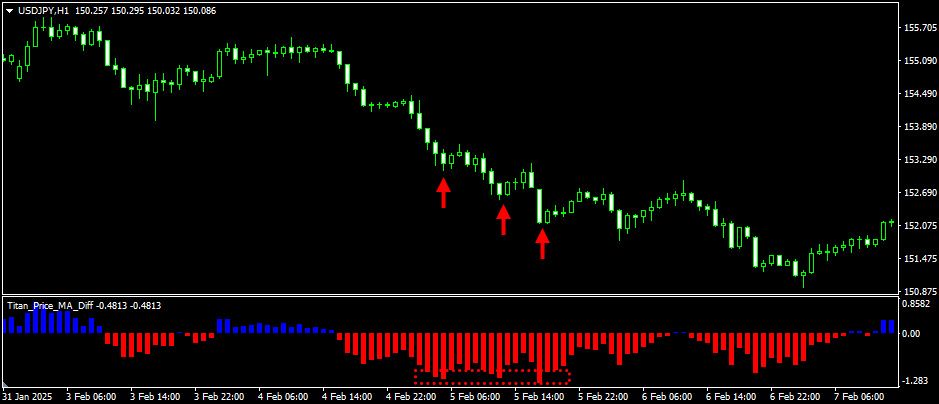
A large divergence between the price and the moving average may suggest the trend is becoming overheated.
By referring to past divergence levels, traders can assess whether the current divergence is relatively large and be cautious of potential short-term reversals.
【Example of Trend Overheating】
Identifying Timing for Buy-on-Dip or Sell-on-Rally
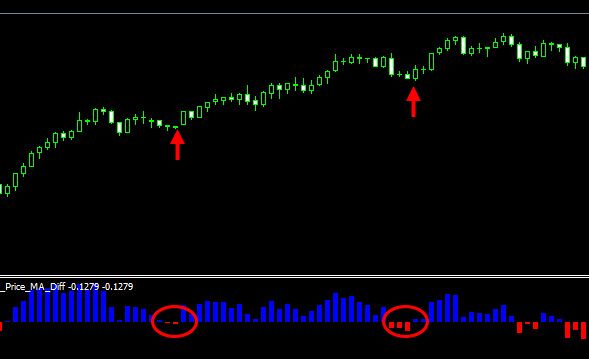
During an ongoing trend, a narrowing divergence or a temporary reversal of the price against the moving average may signal a potential opportunity for a buy-on-dip or sell-on-rally trade in line with the trend.
【Example of a Dip】
*This indicator is only compatible with the Windows versions of MT5 and MT4 provided by TitanFX.
Indicator Terms of Use
Only those who agree to all the following items may use the indicators distributed on this website (https://research.titanfx.com):
1.The indicators and related descriptions are based on various data believed to be reliable, but their accuracy and completeness are not guaranteed.
2.The data displayed by the indicators do not guarantee your investment results. Also, the displayed content may vary due to market conditions and communication environments.
3.Please make investment decisions using indicators at your own risk. We are not responsible for any disadvantages or damages arising from the use of indicators.
4.Specifications of the indicators are subject to change without notice. Changes will be announced on the indicator description pages, etc.
5.Indicators should only be used by customers who have downloaded them. Transferring or selling the indicators to third parties is prohibited.
Indicator Settings
Settings in the "Inputs" tab (for MT5) or the "Parameters" tab (for MT4)
| Variable Name | Description | Default |
|---|---|---|
| Period | Specifies the period for the moving average. | 12 |
| Type | Specifies the type of moving average. | Exponential |
| Applied Price | Selects the price used to calculate the moving average. | Close price |
| Histogram Color (+) | Specifies the color when the value (Price - MA) is positive. | Blue |
| Histogram Color (−) | Specifies the color when the value (Price - MA) is negative. | Red |
Settings in the "Colors" tab (for MT5) or the "Color Settings" tab (for MT4)
Not used in this indicator.