Probability Cone Indicator for Forecasting Future Price Ranges (Titan_Probability_Cone)
Indicator Overview
Titan Probability Cone is a market analysis tool that visualizes the range in which price is statistically likely to remain by drawing a cone extending to the right (into the future) from the current price.
While no one can accurately predict where price will move next, it is possible to estimate how far it is likely to move based on recent market volatility. This indicator calculates that expected price range and displays it as expanding bands over time.
-
Inner Band = Approximately 68% probability range (more conservative)
-
Outer Band = Approximately 95% probability range (wider range)
These two probability zones provide an intuitive estimate of where price is likely to be after a given number of future bars.
How the Indicator Works
The indicator measures the average price movement per bar based on recent market activity and projects that movement into the future. Since uncertainty increases over time, the projected bands gradually widen. However, the widening becomes progressively slower (for example, even if the projection period becomes four times longer, the expected range increases only about twofold). As a result, the projection forms a smooth cone rather than a simple triangle.
Display
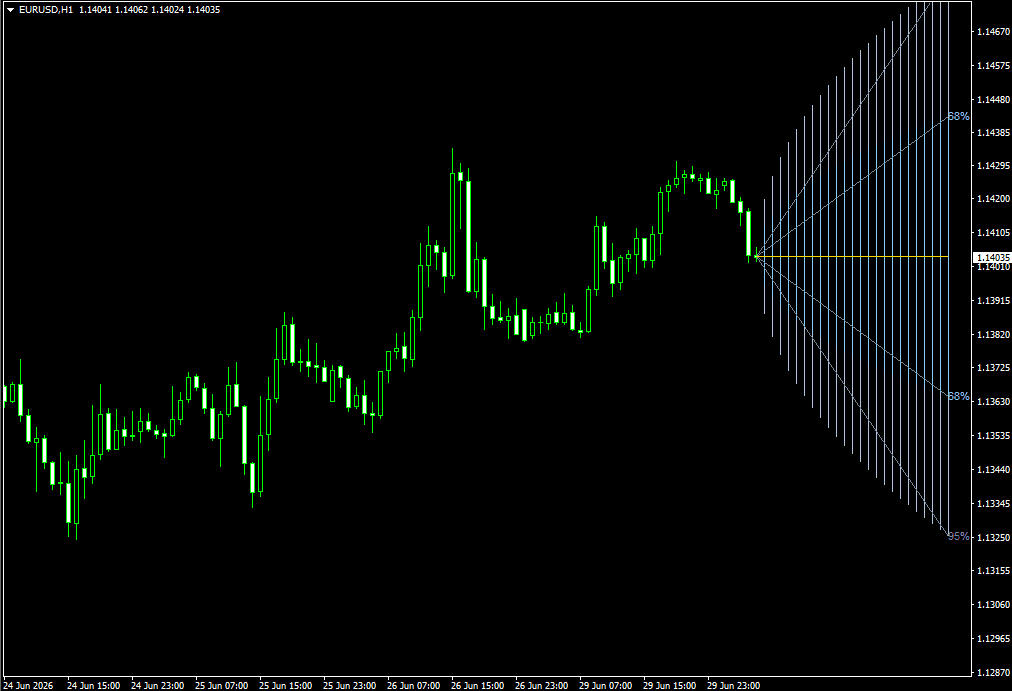
The MT5 version displays semi-transparent gradient bands, while the MT4 version uses transparent-style hatching (thin vertical lines), allowing candlesticks to remain visible beneath the projection.
Optionally, the center line can include a drift based on the recent trend, allowing the cone to tilt in the direction of the prevailing market movement.
This indicator is designed as a support tool for evaluating reasonable take-profit and stop-loss distances, as well as estimating potential price targets after breakouts. It does not generate buy or sell signals. The displayed probabilities are statistical estimates based on historical price behavior, assuming current market conditions continue, and do not guarantee future price movements.
How to Read This Indicator
-
The price labels (68% / 95%) displayed at the right edge of the cone indicate the projected price range at that future point.
-
As price approaches or exceeds the outer (95%) band, it statistically indicates an increasingly extended market.
-
Higher volatility produces a wider cone, while lower volatility results in a narrower cone.
-
Setting the center line drift to Linear Regression tilts the cone in the direction of the recent trend.
Indicator Terms of Use
Only those who agree to all the following items may use the indicators distributed on this website (https://research.titanfx.com):
1.The indicators and related descriptions are based on various data believed to be reliable, but their accuracy and completeness are not guaranteed.
2.The data displayed by the indicators do not guarantee your investment results. Also, the displayed content may vary due to market conditions and communication environments.
3.Please make investment decisions using indicators at your own risk. We are not responsible for any disadvantages or damages arising from the use of indicators.
4.Specifications of the indicators are subject to change without notice. Changes will be announced on the indicator description pages, etc.
5.Indicators should only be used by customers who have downloaded them. Transferring or selling the indicators to third parties is prohibited.
Indicator Settings
Input (for MT5) / Parameter Input (for MT4) Tab Settings
| Variable Name | Description | Default |
|---|---|---|
| Forward bars to project | Specifies how many future bars the cone will project. | 24 |
| Volatility Method | Standard Deviation (STDDEV) or ATR. STDDEV corresponds to the probability labels (68% / 95%). | Standard Deviation |
| Estimation Period (Bars) | Specifies the period used to calculate volatility. | 100 |
| Inner Band Z | Standard deviation multiplier for the inner band (1.0 ≈ 68%). | 1.0 |
| Outer Band Z | Standard deviation multiplier for the outer band (2.0 ≈ 95%). | 2.0 |
| Drift Method | Slope of the center line. Choose None (Horizontal) or Linear Regression Slope. | None |
| Drift Calculation Period | Period used to calculate drift with linear regression. | 50 |
| Inner Band (±1 sigma) Color | Color of the 68% probability band. | LightSkyBlue |
| Outer Band (±2 sigma) Color | Color of the 95% probability band. | LightSteelBlue |
| Center Line Color | Color of the center (projection) line. | Gold |
| Boundary Line Color | Color of the band outlines. | LightSlateGray |
| Fill Transparency | Transparency of the bands (0 = Transparent, 100 = Opaque) MT5 only | 22 |
| Show labels | Enables/disables the probability and price labels displayed at the right edge. | true |
| Redraw on every tick | Updates on every tick when ON (OFF updates only on new bars). | false |
Color (for MT5) / Color Settings (for MT4) Tab Settings
Not used in this indicator.