Indicator to identify trend formation (Titan_RegimeDetector_Hybrid)
Indicator Overview
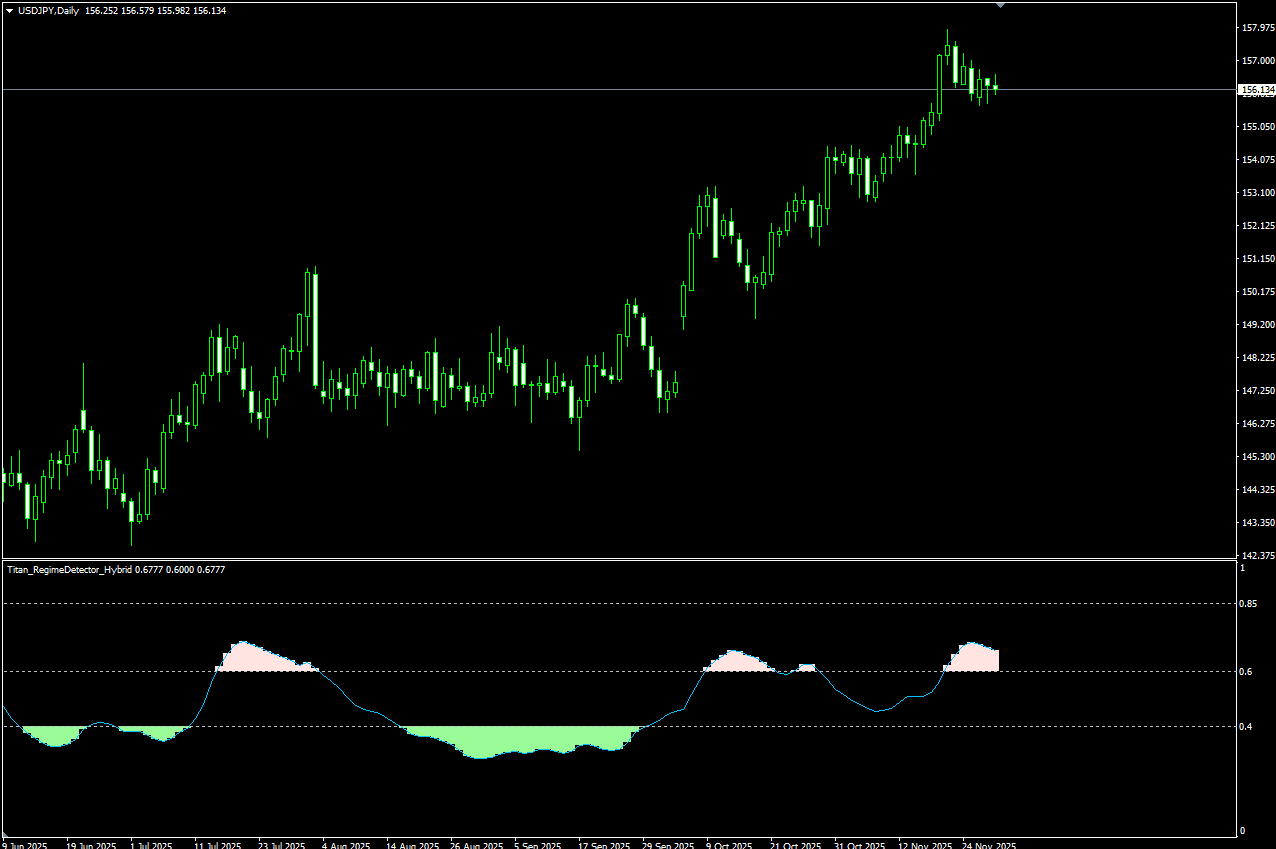
Identify Trend or Range Markets! Indicator Utilizing ADX
In the FX and CFD markets, distinguishing whether the market is trending or ranging is crucial when developing a trading strategy.
This article introduces an indicator based on the ADX (Average Directional Index), which visualizes trend strength on a scale from 0 to 1. It is a practical tool that provides hints for automatically switching between trend-following and counter-trend strategies depending on market conditions.
Identify Trend or Range Markets! Indicator Utilizing ADX
Market conditions can generally be classified into two categories:
- Trend Market (Uptrend / Downtrend)
- Range Market (Sideways / No clear direction)
This indicator quantifies trend strength in real-time from 0 to 1 based on the ADX value and makes the following classifications:
Default Trend Evaluation Criteria and Example Strategies
| Trend Strength (0–1) | Market Condition | Strategy |
|---|---|---|
| 0.00–0.40 | Range Market | Counter-trend strategies effective |
| 0.40–0.60 | Early Trend Formation (Caution: False Signals) | Observe closely and proceed with caution |
| 0.60–0.85 | Clear Trend Formation | Trend-following strategies effective |
| 0.85–1.00 | Overheated Trend | Be cautious of profit-taking or reversals |
With this approach, you can quantitatively assess the market condition, which helps in clearly separating strategies and reducing unnecessary entries.
Specific Usage and Strategy Examples
① When a trend is forming (0.6 or higher)
Strategy: Trend-following
Example: Entering with the trend by buying dips or selling rallies
Note: Confidence increases by confirming trend alignment on higher timeframes.
② When the trend is weak (below 0.4)
Strategy: Primarily counter-trend
Example: Counter-trend entries targeting support/resistance reversals within a range
Note: To avoid false signals, it is effective to use in combination with key horizontal levels or candlestick patterns.
③ When a trend is just beginning (0.4–0.6)
Strategy: Wait-and-see or cautious approach
Example: Make decisions in conjunction with higher timeframe trends or other indicators
Note: Since false signals are possible, it’s safer to avoid immediate entries.
Note: This indicator works only with the Windows versions of TitanFX MT5 and MT4.
Indicator Terms of Use
Only those who agree to all the following items may use the indicators distributed on this website (https://research.titanfx.com):
1.The indicators and related descriptions are based on various data believed to be reliable, but their accuracy and completeness are not guaranteed.
2.The data displayed by the indicators do not guarantee your investment results. Also, the displayed content may vary due to market conditions and communication environments.
3.Please make investment decisions using indicators at your own risk. We are not responsible for any disadvantages or damages arising from the use of indicators.
4.Specifications of the indicators are subject to change without notice. Changes will be announced on the indicator description pages, etc.
5.Indicators should only be used by customers who have downloaded them. Transferring or selling the indicators to third parties is prohibited.
Indicator Settings
Input (for MT5) or Parameters (for MT4) Tab Settings
| Variable Name | Description | Default |
|---|---|---|
| Range Upper Threshold | Specifies the threshold (0–1) to determine range market. | 0.4 |
| Trend Lower Threshold | Specifies the threshold (0–1) to determine trend market. | 0.6 |
| Overheated Threshold | Specifies the threshold (0–1) to determine overheated trends. | 0.85 |
| Line Color | Specifies the color of the line displaying the indicator value. | DeepSkyBlue |
| Range Color | Specifies the background color when a range is detected. | PaleGreen |
| Trend Color | Specifies the background color when a trend is detected. | MistyRose |
| Overheat Color | Specifies the background color when the trend is overheated. | Magenta |
| Analysis Length | Specifies the period used for trend/range detection. | 50 |
| EMA Smoothing | Value used to smooth the composite of ADX, BB, and residual correlation weights. | 5 |
| ADX Weight | Specifies the ADX ratio used for trend/range detection. | 0.5 |
| ADX Period | Specifies the ADX calculation period. | 14 |
| BB Weight | Specifies the BB ratio used for trend/range detection. | 0.3 |
| BB Period | Specifies the BB calculation period. | 20 |
| BB Deviation | Specifies the standard deviation for BB. | 0.2 |
| ATR Period | ATR period used to normalize the BB width. | 14 |
| Residual Correlation Weight | Specifies the residual correlation ratio used for trend/range detection. | 0.2 |
| Detrend EMA Period | Specifies the moving average period used for residual correlation calculation. | 34 |
Color (for MT5) or Color Settings (for MT4) Tab
Not used in this indicator.