Indicator based on RSI that notifies potential trend reversals (Titan_RSI_Bands)
Identifying Market Reversal Timing with RSI and Bollinger Bands
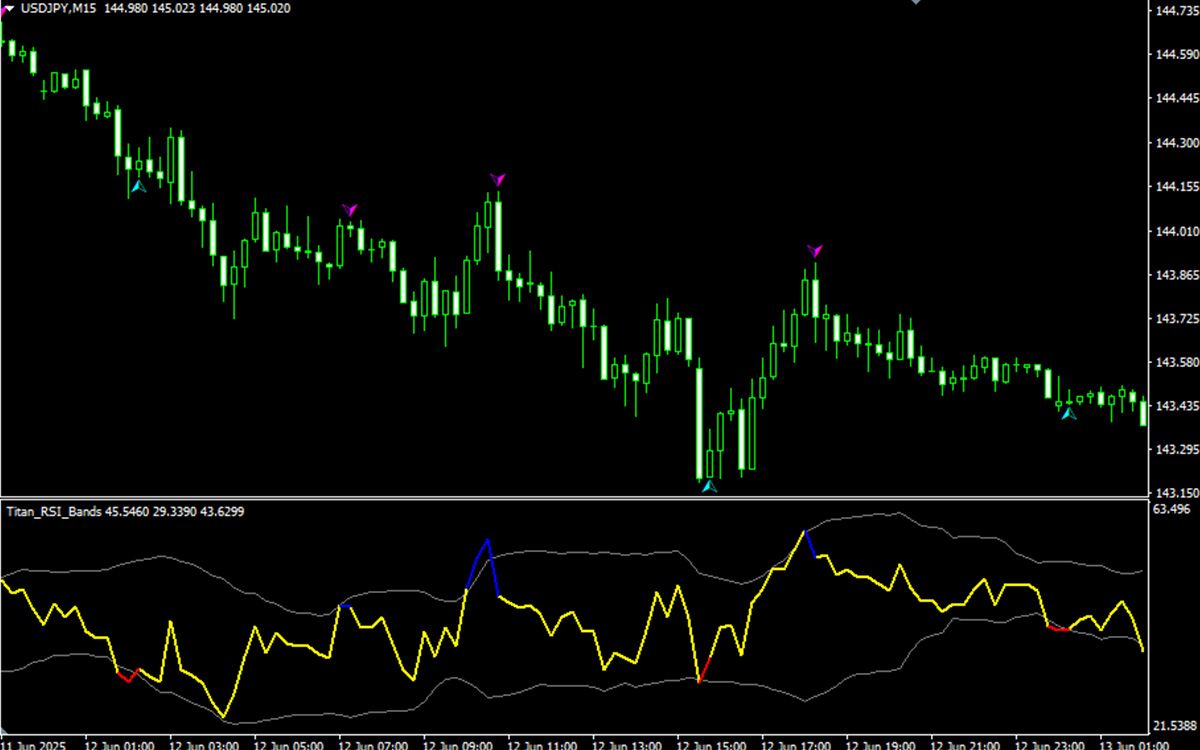
This indicator identifies potential market reversal points by applying Bollinger Bands to the RSI.
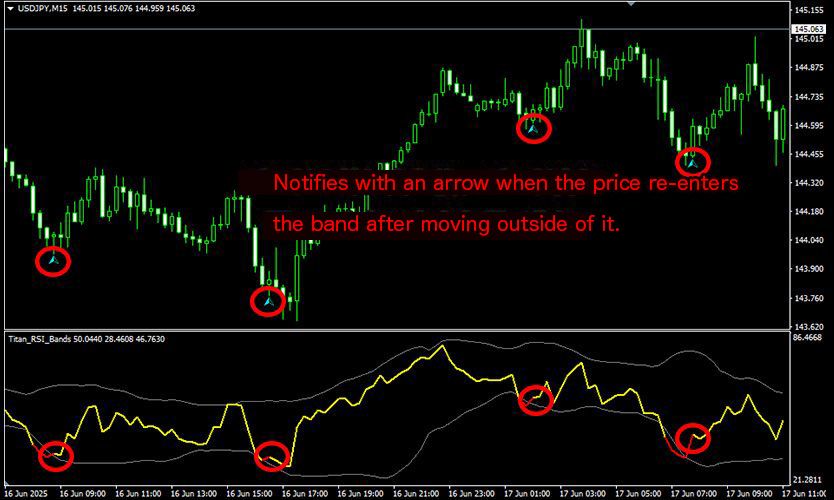
Specifically, when the RSI value moves outside the Bollinger Bands and then re-enters the band, the indicator considers this a peak-out timing and signals it with an arrow.
It can be used to identify entry points for trades targeting market reversals, or to determine profit-taking timing during trend-following trades.
【Indicator Display Example】
*This indicator works only on the Windows versions of MT5 and MT4 provided by TitanFX.
Indicator Terms of Use
Only those who agree to all the following items may use the indicators distributed on this website (https://research.titanfx.com):
1.The indicators and related descriptions are based on various data believed to be reliable, but their accuracy and completeness are not guaranteed.
2.The data displayed by the indicators do not guarantee your investment results. Also, the displayed content may vary due to market conditions and communication environments.
3.Please make investment decisions using indicators at your own risk. We are not responsible for any disadvantages or damages arising from the use of indicators.
4.Specifications of the indicators are subject to change without notice. Changes will be announced on the indicator description pages, etc.
5.Indicators should only be used by customers who have downloaded them. Transferring or selling the indicators to third parties is prohibited.
Indicator Settings
Input Tab (for MT5), or Parameters Tab (for MT4)
| Variable Name | Description | Default |
|---|---|---|
| Period | Specifies the RSI period. | 14 |
| Thickness | Specifies the line thickness of the RSI. | 2 |
| Color | Specifies the color of the RSI line. | Yellow |
| Upper Band Outside Color | Specifies the line color when the RSI is above the Bollinger Bands. | Blue |
| Lower Band Outside Color | Specifies the line color when the RSI is below the Bollinger Bands. | Red |
| Period | Specifies the period for the Bollinger Bands. | 20 |
| Standard Deviation | Specifies the standard deviation value for the Bollinger Bands. | 2.0 |
| Thickness | Specifies the line thickness of the displayed Bollinger Bands. | 1 |
| Color | Specifies the color of the displayed Bollinger Bands. | Gray |
| Up Arrow Color | Specifies the arrow color indicating a potential rise. | Aqua |
| Down Arrow Color | Specifies the arrow color indicating a potential decline. | Magenta |
Color Tab (for MT5), or Color Settings Tab (for MT4)
Not used in this indicator.