Indicator that Draws Lines on RSI and Notifies Breakouts (Titan_RSI_Trend)
Automatically Display Lines on RSI and Notify Breakouts
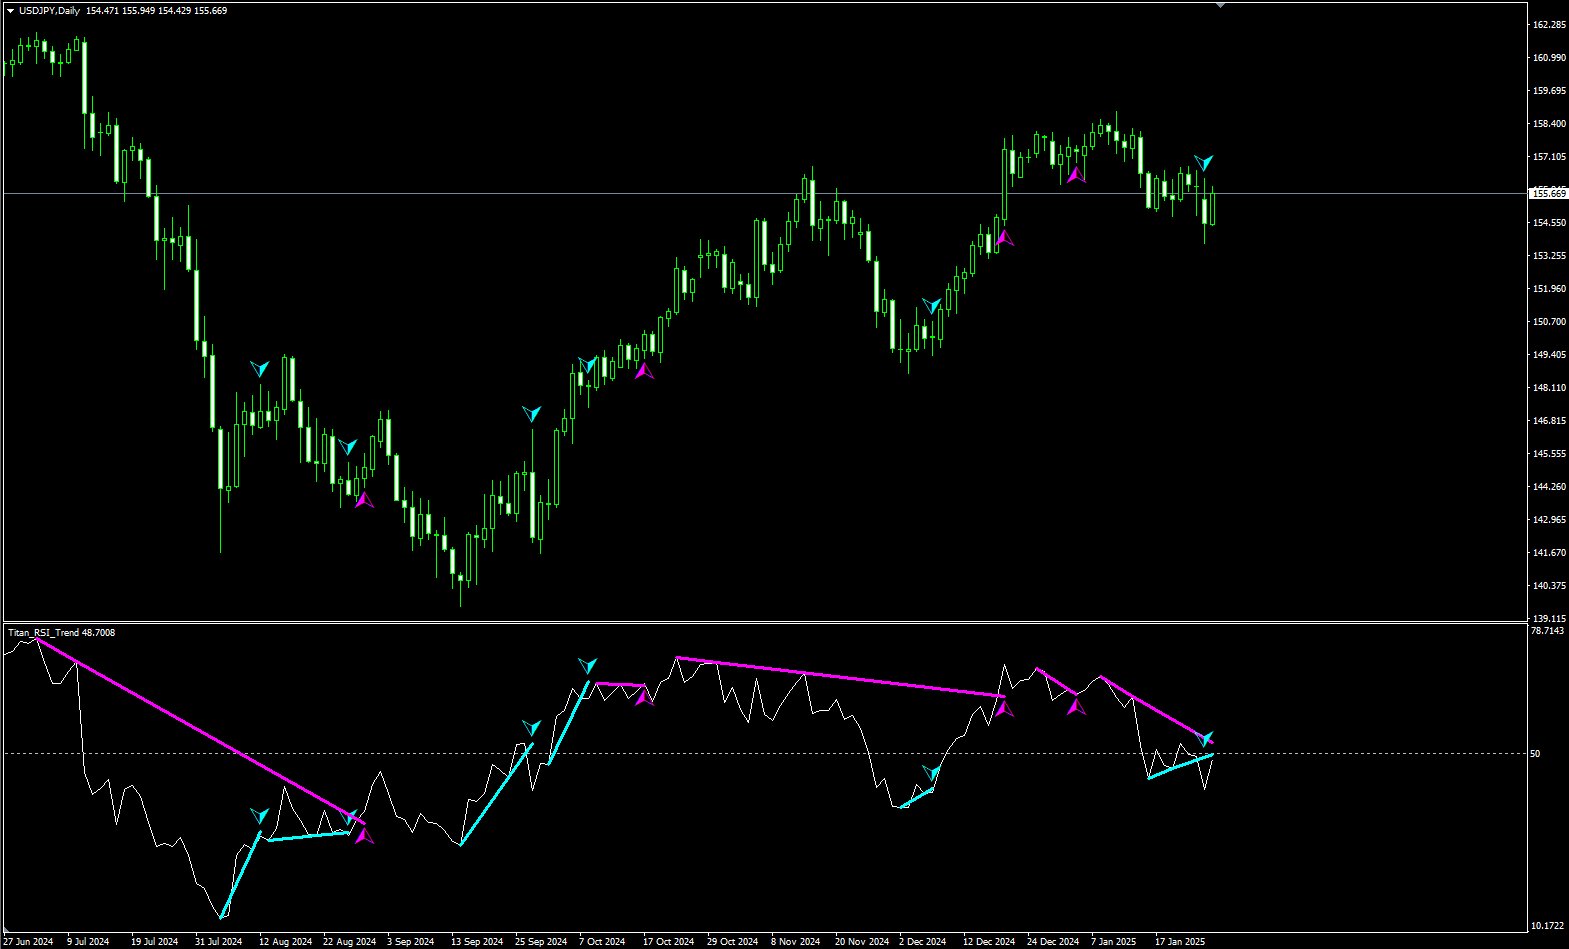
This indicator draws trend lines on RSI and notifies you with an arrow when the line is broken.
When the trend line drawn on the RSI is broken, the possibility of a trend reversal increases, making it useful for determining entry and exit timing.
Once the indicator is activated, the RSI with the trend line drawn will be displayed. When the trend line is broken, an arrow will appear on both the RSI and the chart to notify you.
【Example of Indicator Display】

※This indicator is compatible only with the Windows versions of MT5 and MT4 from TitanFX.
Indicator Terms of Use
Only those who agree to all the following items may use the indicators distributed on this website (https://research.titanfx.com):
1.The indicators and related descriptions are based on various data believed to be reliable, but their accuracy and completeness are not guaranteed.
2.The data displayed by the indicators do not guarantee your investment results. Also, the displayed content may vary due to market conditions and communication environments.
3.Please make investment decisions using indicators at your own risk. We are not responsible for any disadvantages or damages arising from the use of indicators.
4.Specifications of the indicators are subject to change without notice. Changes will be announced on the indicator description pages, etc.
5.Indicators should only be used by customers who have downloaded them. Transferring or selling the indicators to third parties is prohibited.
Indicator Settings
Input (for MT5) / Parameter Input (for MT4) Tab Settings
| Variable Name | Description | Default |
|---|---|---|
| Period (RSI) | Specifies the period of RSI. | 14 |
| Applied Price (RSI) | Specifies the type of price used to calculate RSI. | Close price |
| Arrow Display | Specifies whether to display arrows on the chart. Select "true" to display, "false" to hide. | true |
| Interval (Resistance) | Specifies how many bars to skip from the first peak when drawing the resistance line (used to detect reversals from downtrend to uptrend). If set to 10, the indicator will ignore peaks within the first 10 bars when drawing the line. | 1 |
| Color (Resistance) | Specifies the color of the resistance line. | Magenta |
| Line Width (Resistance) | Specifies the thickness of the resistance line. | 1 |
| Interval (Support) | Specifies how many bars to skip from the first trough when drawing the support line (used to detect reversals from uptrend to downtrend). If set to 10, the indicator will ignore troughs within the first 10 bars when drawing the line. | 1 |
| Color (Support) | Specifies the color of the support line. | Magenta |
| Line Width (Support) | Specifies the thickness of the support line. | 1 |
Colors (for MT5) / Color Settings (for MT4) Tab Settings
This indicator does not use this setting.