Market Structure Mapping Indicator (BOS, CHoCH & Order Blocks) (Titan_StructureMapper)
Indicator Overview
Titan_StructureMapper is a market structure analysis tool based on the globally popular Smart Money Concept (SMC) and Price Action methodology. It automatically analyzes market structure (trend and key levels) and displays the results on the chart using color-coded visuals.
Determining whether the market is currently trending upward, preparing for a reversal, or likely to react at a particular price level normally requires experience and practice. This indicator automatically detects swing highs, swing lows, and important market structure levels, making the current market condition easy to understand even for beginners.
Four Elements Displayed Automatically
| Item | Description |
|---|---|
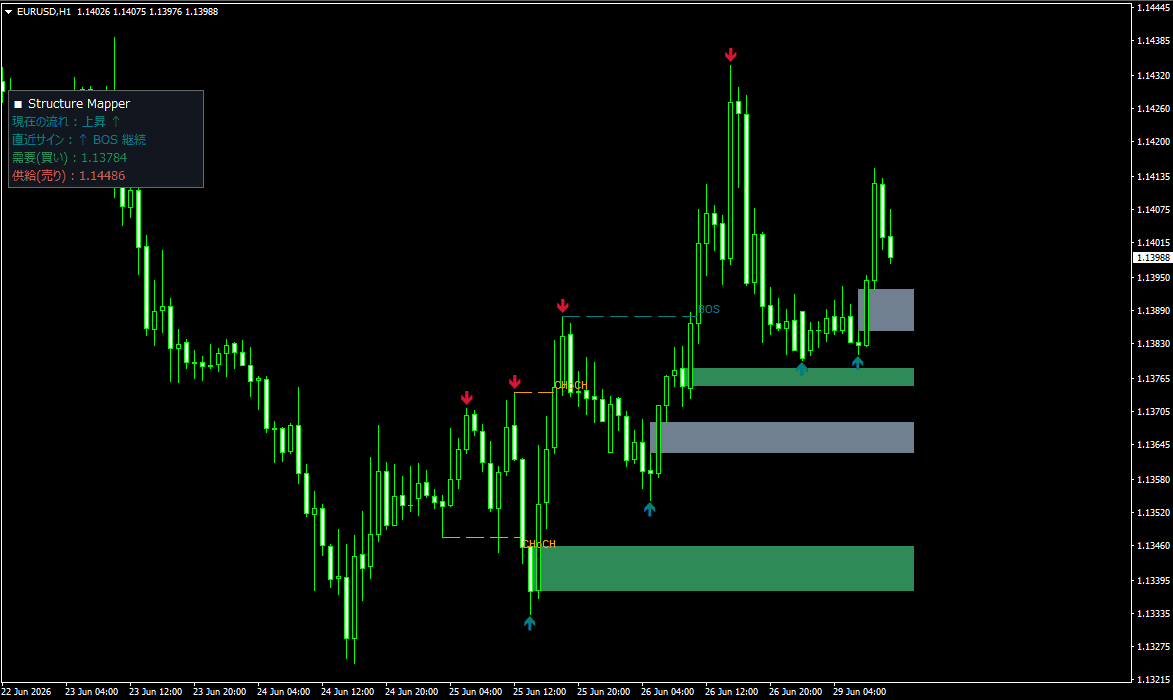
| Swing Highs & Lows | Marks the market's "peaks" and "troughs," forming the foundation of all market structure analysis (Red ▼ = Swing High, Teal ▲ = Swing Low). |
| BOS (Break of Structure) | Occurs when price breaks above the previous swing high or below the previous swing low, indicating that the current trend is likely to continue. |
| CHoCH (Change of Character) | Occurs when price breaks a key structure against the existing trend, providing the first indication that the trend may be reversing. |
| OB (Order Block) | The last opposite-direction candle before a strong price move. These zones are considered areas where institutional (smart money) orders may have been placed, making them potential support or resistance areas when price revisits them (Green = Buy / Red = Sell). |
| FVG (Fair Value Gap) | A three-candle price imbalance created by a strong move. These gaps are areas where price often returns later to "fill the gap" (hidden by default). |
Designed for Better Readability
Displaying every detected structure at once would clutter the chart. Therefore, this indicator displays only the most relevant and currently effective information.
① Mitigation (Automatically Removes Filled Zones)
Zones that have already been invalidated after price has moved through them are automatically removed. Only currently valid zones remain on the chart.
② Prioritizes Recent Structures with Display Limits
Zones and structure labels prioritize the most recent ones, while display limits prevent excessive information from appearing on the chart.
③ Summary Panel (Upper Left Corner)
The following three items are always displayed for a quick overview of the current market condition.
Current Trend … Uptrend / Downtrend / Range
Latest Signal … BOS (Continuation) / CHoCH (Reversal)
Key Zone Prices … Demand (Buy) / Supply (Sell)
This indicator is designed to assist with market structure analysis and does not generate direct buy or sell signals. All detected structures and zones are based on historical price action.
Indicator Terms of Use
Only those who agree to all the following items may use the indicators distributed on this website (https://research.titanfx.com):
1.The indicators and related descriptions are based on various data believed to be reliable, but their accuracy and completeness are not guaranteed.
2.The data displayed by the indicators do not guarantee your investment results. Also, the displayed content may vary due to market conditions and communication environments.
3.Please make investment decisions using indicators at your own risk. We are not responsible for any disadvantages or damages arising from the use of indicators.
4.Specifications of the indicators are subject to change without notice. Changes will be announced on the indicator description pages, etc.
5.Indicators should only be used by customers who have downloaded them. Transferring or selling the indicators to third parties is prohibited.
Indicator Settings
Input (for MT5) / Parameter Input (for MT4) Tab Settings
| Variable Name | Description | Default |
|---|---|---|
| Scan bars | Number of bars used for market structure analysis | 500 |
| Fractal bars each side | Number of bars on each side for swing detection (Higher = Larger swings / Lower = Smaller swings) | 3 |
| Bars to extend zones right | Number of bars to extend OB/FVG zones to the right | 3 |
| Swing High/Low Markers | Enables/disables swing high and swing low markers (▲▼) | true |
| Show BOS | Enables/disables BOS (trend continuation) display | true |
| Show CHoCH | Enables/disables CHoCH (trend reversal) display | true |
| Order Blocks | Enables/disables Order Block (OB) zones | true |
| Fair value gaps | Enables/disables Fair Value Gap (hidden by default) | false |
| Hide Mitigated Zones | Hides mitigated (invalidated) zones | true |
| Summary Panel | Enables/disables the upper-left summary panel | true |
| Max Zones per Type(OB/FVG) | Maximum number of zones displayed for each side (most recent first) | 2 |
| Max BOS/CHoCH Labels | Maximum number of structure break labels displayed | 3 |
| Max Swing Markers | Maximum number of swing markers (▲▼) displayed | 8 |
| Bullish Structure | Color for swing lows, bullish BOS, etc. | Teal |
| Bearish Structure | Color for swing highs, bearish BOS, etc. | Crimson |
| CHoCH | Color for CHoCH (trend reversal) | Orange |
| Bullish OB (Demand) | Color for demand (buy) zones | SeaGreen |
| Bearish OB (Supply) | Color for supply (sell) zones | IndianRed |
| FVG | Color for Fair Value Gap zones | SlateGray |
Color (for MT5) / Color Settings (for MT4) Tab Settings
Not used in this indicator.