Indicator for Displaying the "Price Condition" of Each Timeframe (Titan_TF_MomentumGraph)
Indicator Overview
Understanding the "Price Condition" of Each Timeframe
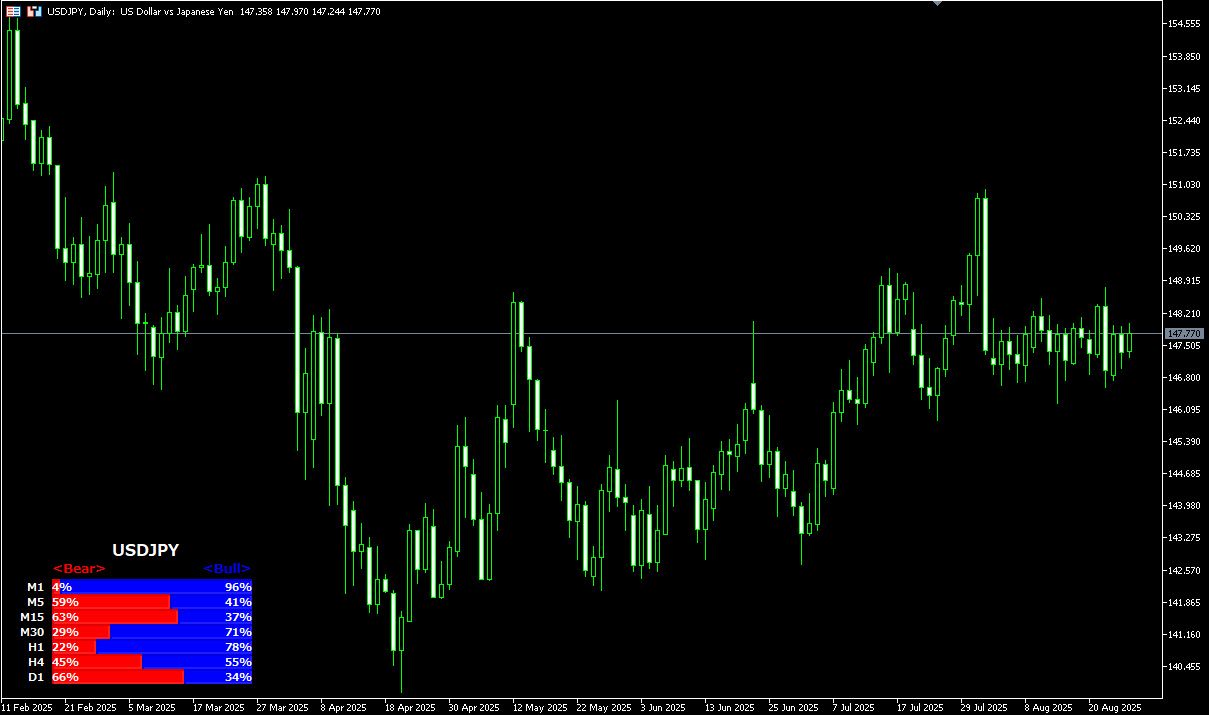
This indicator displays the current price level, in numerical form, within the high-low range of the most recent candles (default is 20) for each timeframe, including 1-minute, 5-minute, 15-minute, 1-hour, 4-hour, and daily charts.
Multi-timeframe analysis is crucial in any market, whether it's FX, stocks, or cryptocurrencies.
For example, when entering a trade on the 5-minute chart, understanding the trend on the 1-hour or daily chart can lead to more accurate trade decisions.
Opening multiple timeframes individually to check them can be time-consuming, but with this indicator, you can display the momentum and price positions across multiple timeframes on a single chart at once.
How to Read the Graph
This indicator overlays bar graphs at a specified position to show the status of each timeframe.
The graphs are displayed in order from the shorter to the longer timeframes. You can visually check where the current price stands within the high-low range of the specified number of candles.
The Bear (bearish) value (%) shows how far from the top of the range the price is, while the Bull (bullish) value shows how far from the bottom it is. These two values are designed to always total 100%.
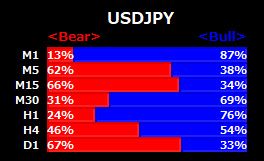
【Graph Display Example】
Note: This indicator only works on the Windows versions of MT5 and MT4 provided by TitanFX.
Indicator Terms of Use
Only those who agree to all the following items may use the indicators distributed on this website (https://research.titanfx.com):
1.The indicators and related descriptions are based on various data believed to be reliable, but their accuracy and completeness are not guaranteed.
2.The data displayed by the indicators do not guarantee your investment results. Also, the displayed content may vary due to market conditions and communication environments.
3.Please make investment decisions using indicators at your own risk. We are not responsible for any disadvantages or damages arising from the use of indicators.
4.Specifications of the indicators are subject to change without notice. Changes will be announced on the indicator description pages, etc.
5.Indicators should only be used by customers who have downloaded them. Transferring or selling the indicators to third parties is prohibited.
Indicator Settings
Input Tab (for MT5) / Parameters Tab (for MT4)
| Variable Name | Description | Default |
|---|---|---|
| Period | Specifies the number of candles to consider. | 20 |
| Text Color | Sets the color of the displayed text. | White |
| Bullish Color | Sets the color for the bullish portion. | Blue |
| Bearish Color | Sets the color for the bearish portion. | Red |
| Display Position | Specifies where the graph will be shown. | Bottom Left |
| Show M1 | Whether to display the status of the 1-minute chart. | true |
| Show M5 | Whether to display the status of the 5-minute chart. | true |
| Show M15 | Whether to display the status of the 15-minute chart. | true |
| Show M30 | Whether to display the status of the 30-minute chart. | true |
| Show H1 | Whether to display the status of the 1-hour chart. | true |
| Show H4 | Whether to display the status of the 4-hour chart. | true |
| Show D1 | Whether to display the status of the daily chart. | true |
Colors Tab (for MT5) / Color Settings Tab (for MT4)
Not used in this indicator.