Bollinger Band Width Indicator (Titan_BB_width)
Indicator Overview
Clearly Displaying Changes in Bollinger Band Width
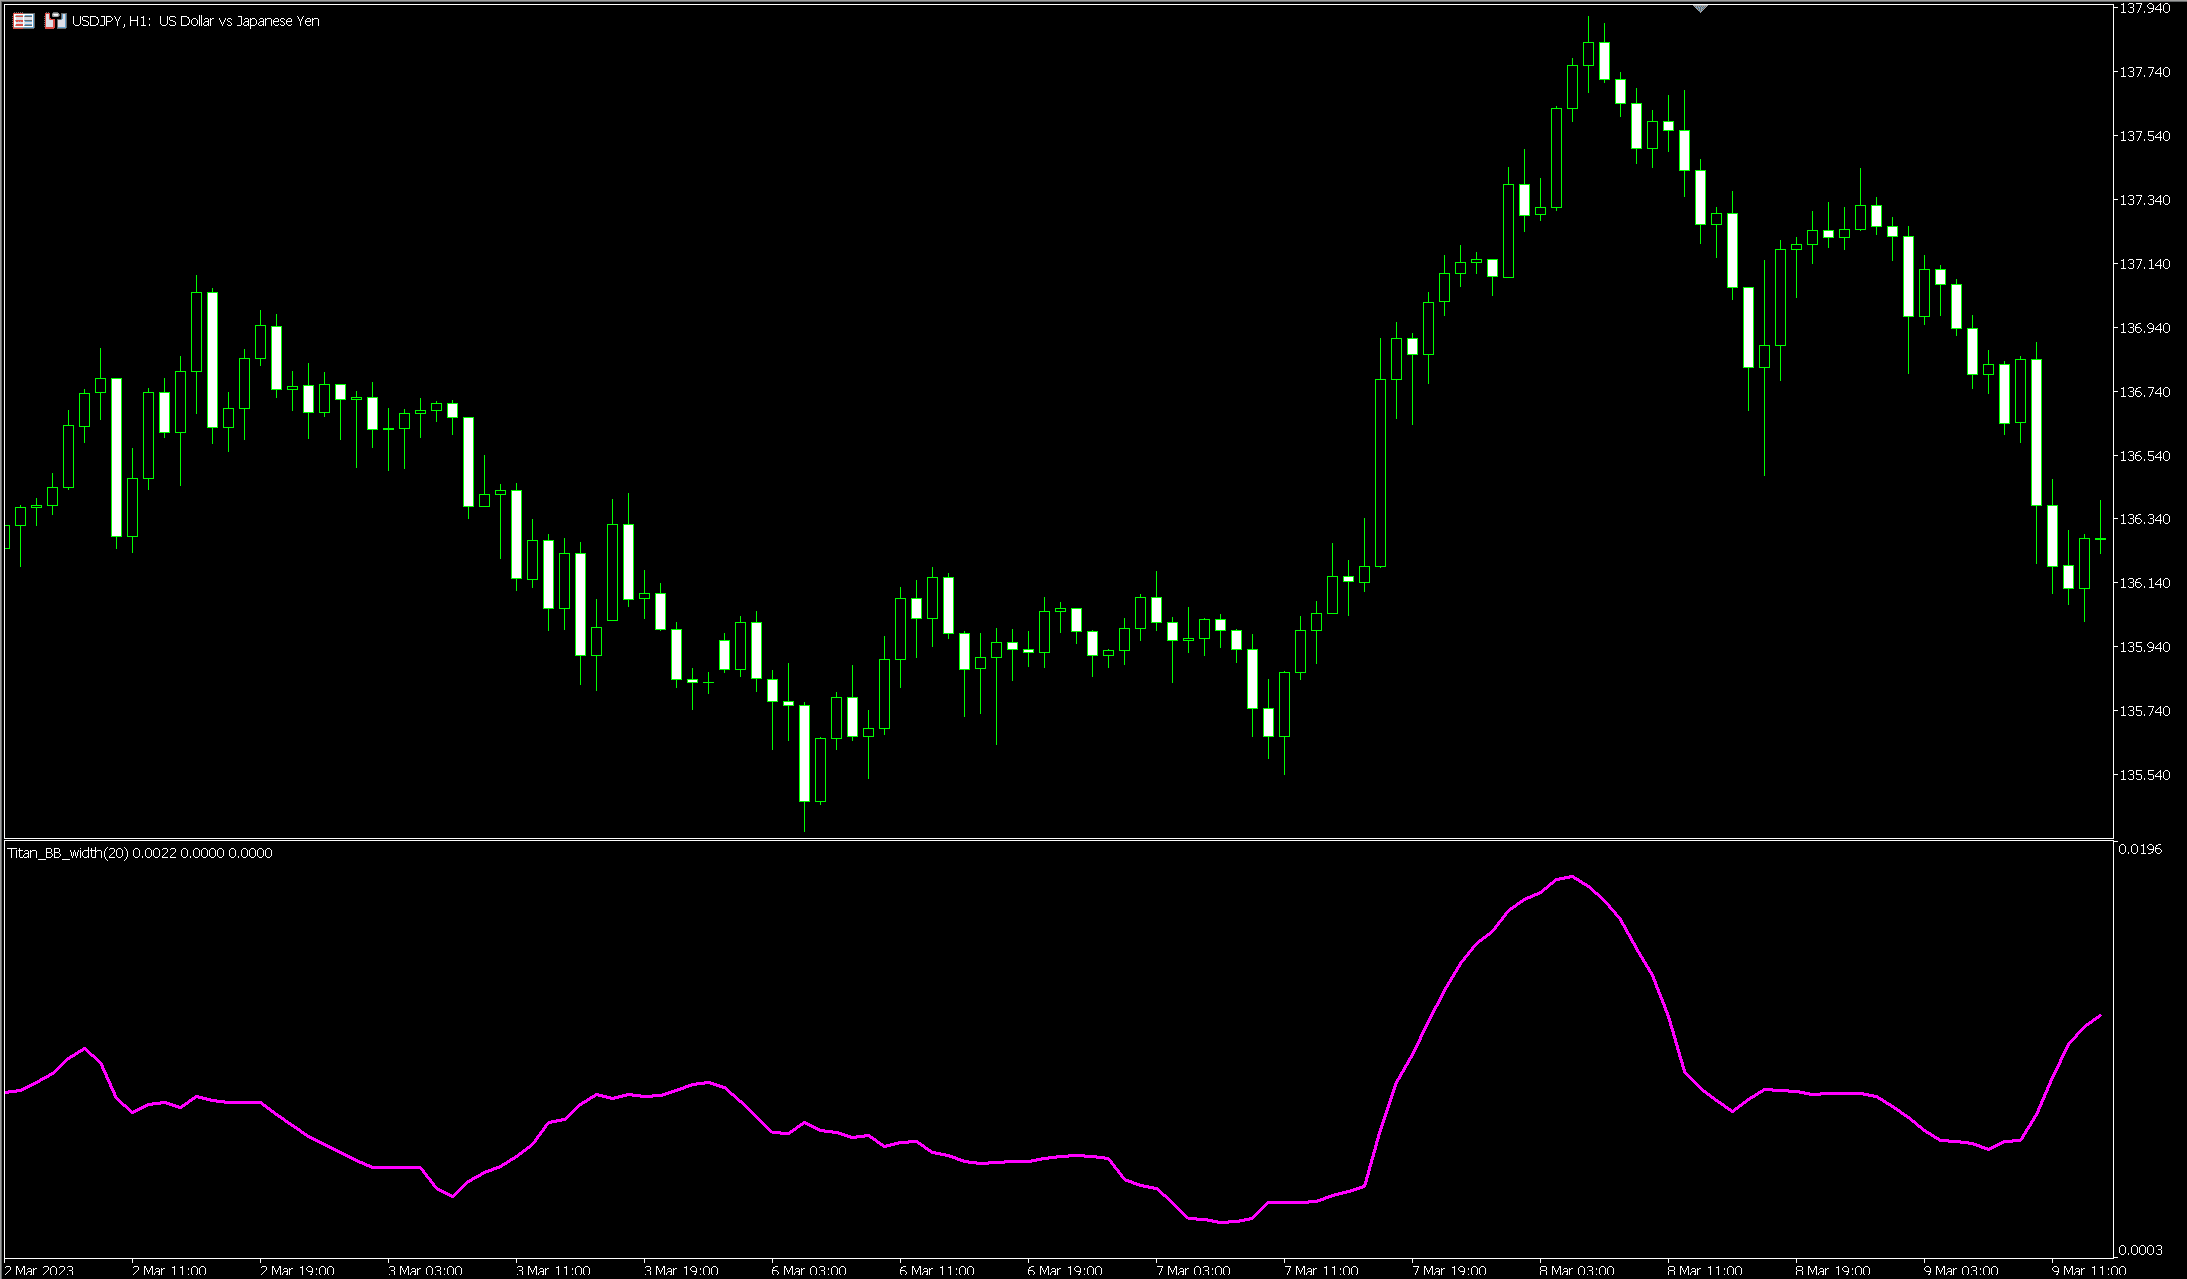
The Bollinger Band Width (Titan_BB_width) indicator displays the width of the Bollinger Bands on a sub-chart.
While it is difficult to observe minor changes in band width with standard Bollinger Bands, this indicator allows for efficient monitoring of changes in band width.
Besides a simple line display, it can also be displayed as a histogram (bar chart), where the color changes based on the increase or decrease from the previous bar, making it easier to grasp the contraction of the band width.
This can be used to target the onset of trends after the bands contract and gather strength, or to identify peak timing in trends.
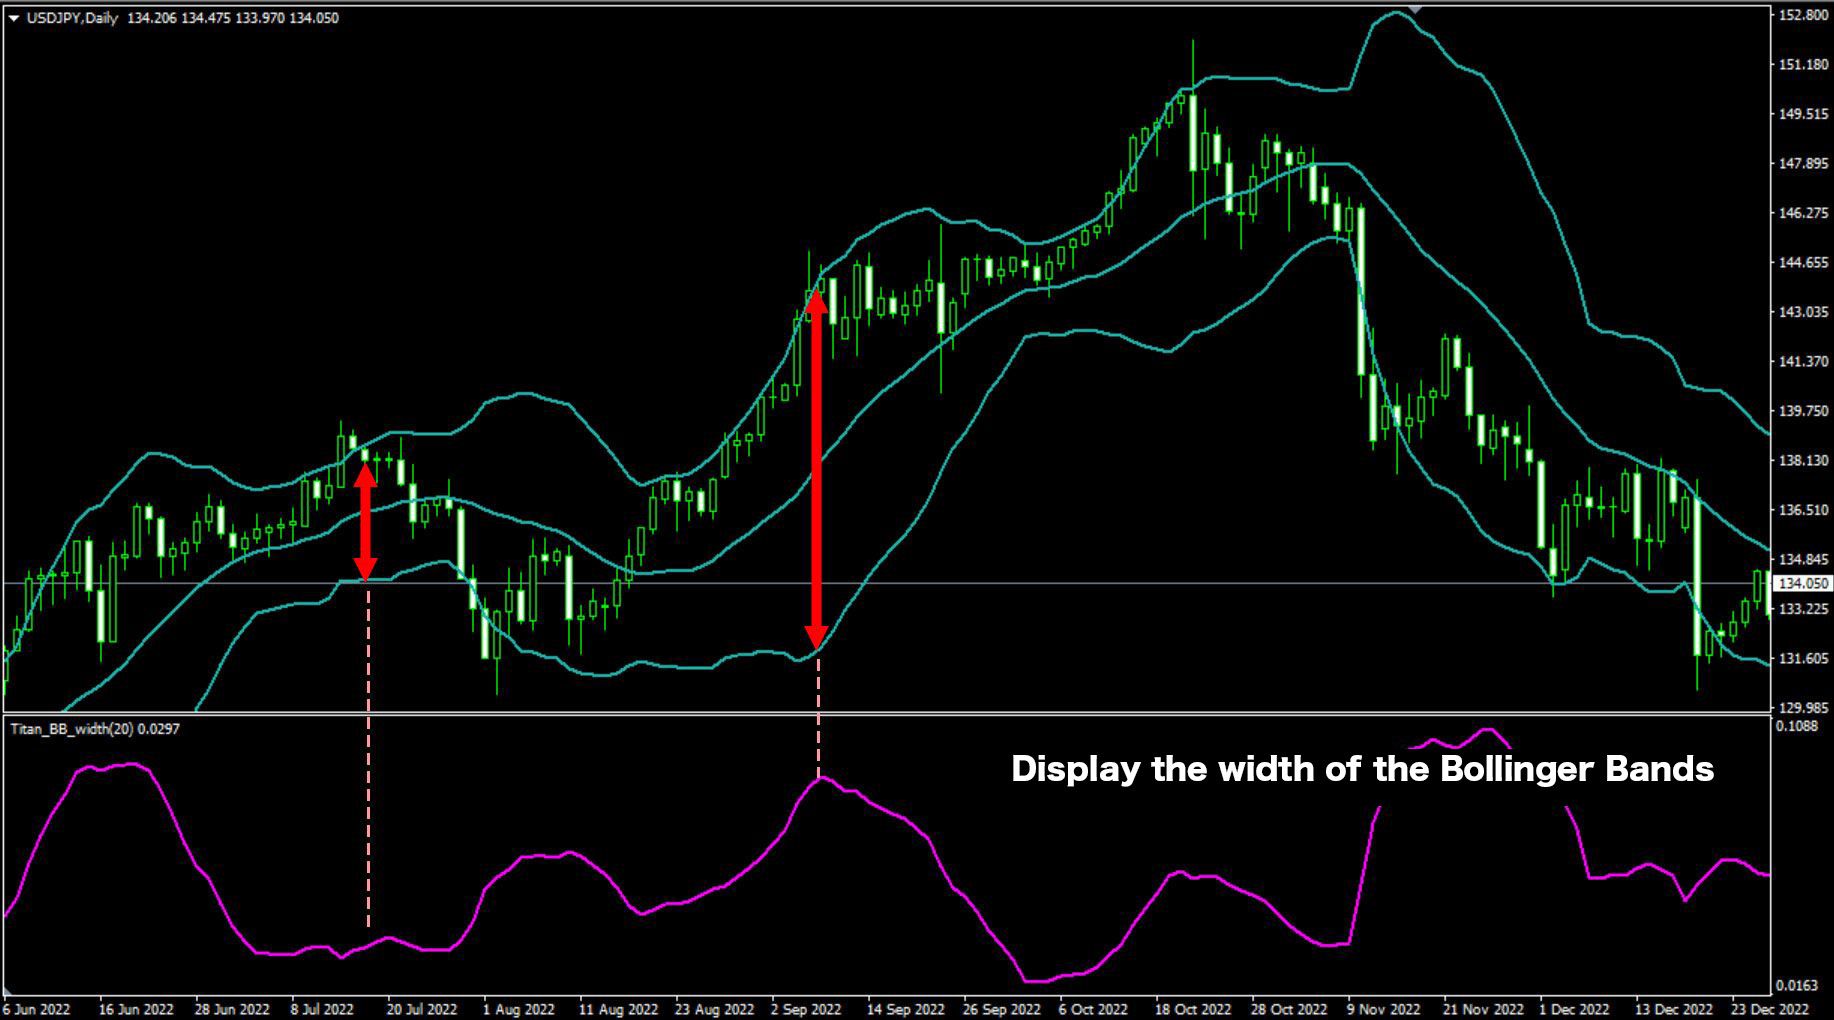
【Comparison of Bollinger Bands (on the main chart) and Bollinger Band Width (on the sub-chart)】
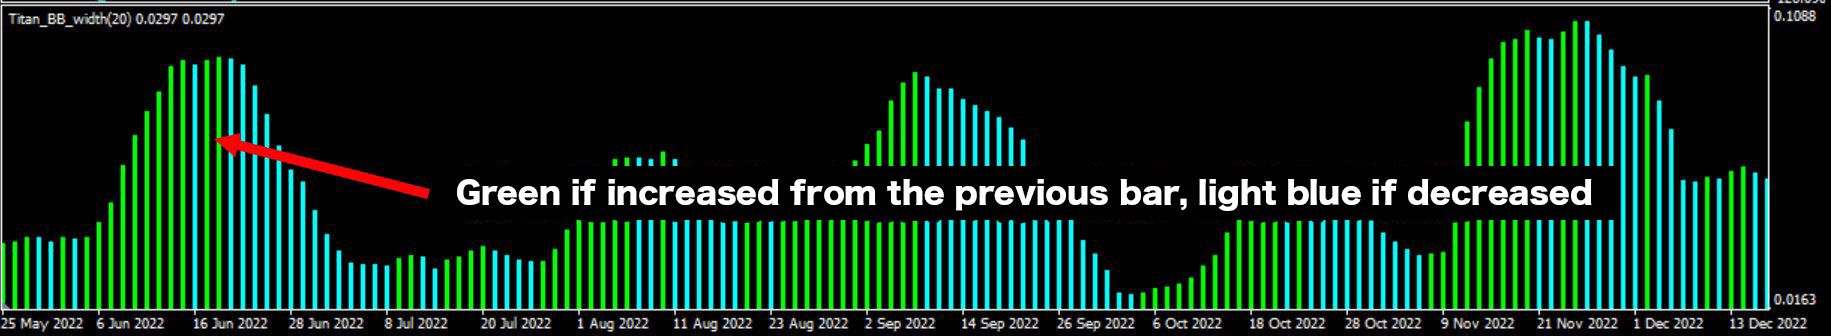
When Displayed as a Histogram
When displayed as a histogram, it shows different colors for increases or decreases from the previous bar, making it easier to understand the contraction status of the width. By default, if the width has increased from the previous bar, it is displayed in green, and if it has decreased, it is displayed in light blue.
【Example of Histogram Display】
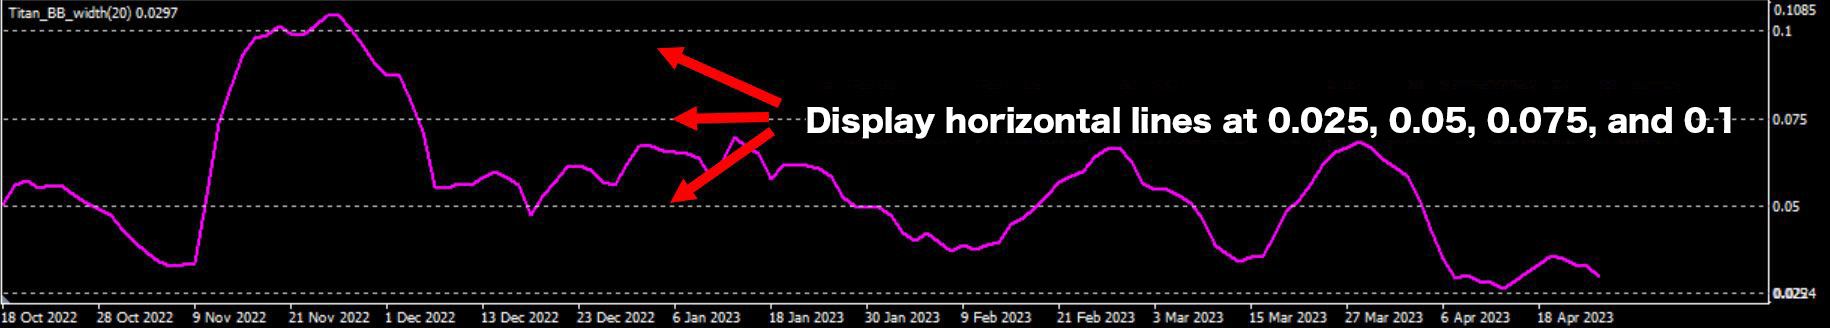
Line Display is Recommended in Combination with Level Display
When displaying as a line, adding arbitrary levels (horizontal lines) in the 'Display Levels' setting on the indicator settings screen can make analysis more efficient.
By adding levels at specified points as shown in the next image, it becomes easier to understand changes in width.
【Example of Analysis Using Simple Line and Level Display】
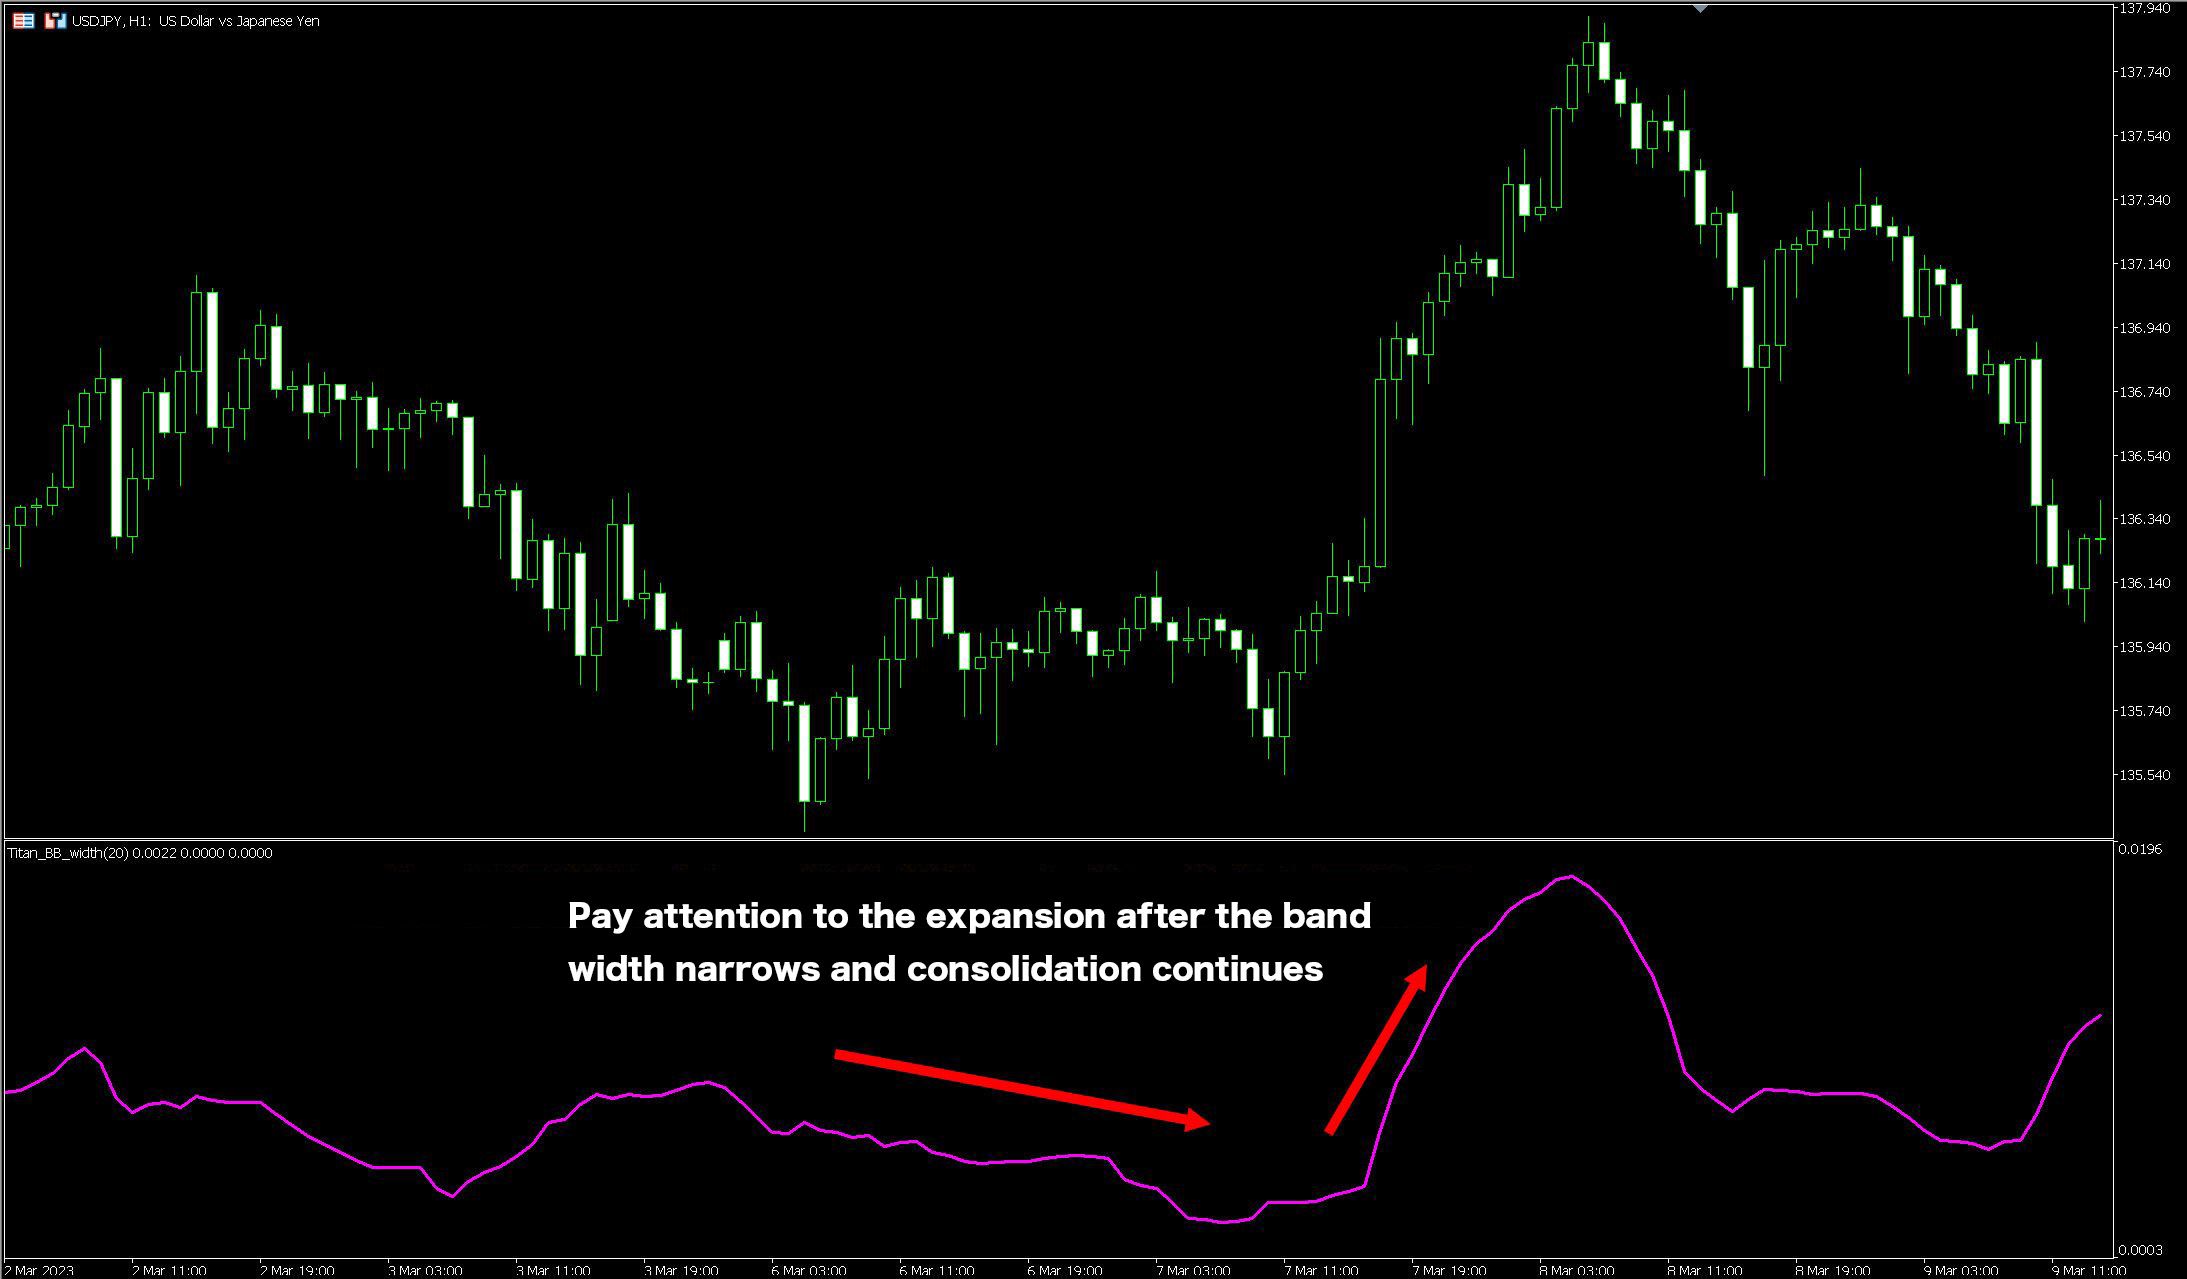
Focus on Movement from Contraction to Diffusion of Bollinger Bands
There are various ways to analyze using Bollinger Bands, but when the bands contract and then diffuse upwards or downwards, there tends to be a momentum in trends.
Using the Bollinger Band Width indicator, the contraction status of the bands is clearly visible.
【Example of Bollinger Bands Contracting and then Diffusing】
※ This indicator only works with the Windows versions of MT5 and MT4 from TitanFX.
Indicator Terms of Use
Only those who agree to all the following items may use the indicators distributed on this website (https://research.titanfx.com):
1.The indicators and related descriptions are based on various data believed to be reliable, but their accuracy and completeness are not guaranteed.
2.The data displayed by the indicators do not guarantee your investment results. Also, the displayed content may vary due to market conditions and communication environments.
3.Please make investment decisions using indicators at your own risk. We are not responsible for any disadvantages or damages arising from the use of indicators.
4.Specifications of the indicators are subject to change without notice. Changes will be announced on the indicator description pages, etc.
5.Indicators should only be used by customers who have downloaded them. Transferring or selling the indicators to third parties is prohibited.
Indicator Settings
Input (for MT5), Parameter Input (for MT4) Tab Settings
| Variable Name | Description | Default |
|---|---|---|
| Moving average type | Choose the type of moving average for the center line. Options include Simple (SMA), Exponential (EMA), Smoothed (SMMA), and Linear weighted (LWMA). | Simple |
| Term | Specifies the period of the moving average. | 20 |
| Standard deviation | Specifies the value of the standard deviation, selectable from 1 to 3. | 2 |
| Which candlestick price? | Specifies the price to be used. | Close price |
| Shift | Use this to shift the display position left or right. Entering a positive integer shifts it right, and a negative integer shifts it left. | 0 |
| Chart type | Specifies whether to display as a line or a histogram. | Line |
Color (for MT5), Color Settings (for MT4) Tab Settings
| MT5 | MT4 | Description |
|---|---|---|
| 0 | 0 | Color, thickness, and type of the line |
| 1 | 1 | Color, thickness, and type of the histogram when increased from the previous period |
| 2 | 2 | Color, thickness, and type of the histogram when decreased from the previous period |
Indicator Terms of Use
Only those who agree to all the following items may use the indicators distributed on this website (https://research.titanfx.com):
1.The indicators and related descriptions are based on various data believed to be reliable, but their accuracy and completeness are not guaranteed.
2.The data displayed by the indicators do not guarantee your investment results. Also, the displayed content may vary due to market conditions and communication environments.
3.Please make investment decisions using indicators at your own risk. We are not responsible for any disadvantages or damages arising from the use of indicators.
4.Specifications of the indicators are subject to change without notice. Changes will be announced on the indicator description pages, etc.
5.Indicators should only be used by customers who have downloaded them. Transferring or selling the indicators to third parties is prohibited.