Multi-Timeframe Bollinger Bands (Titan_Multi_BollingerBands)
Indicator Overview
Displaying Multi-Timeframe Bollinger Bands
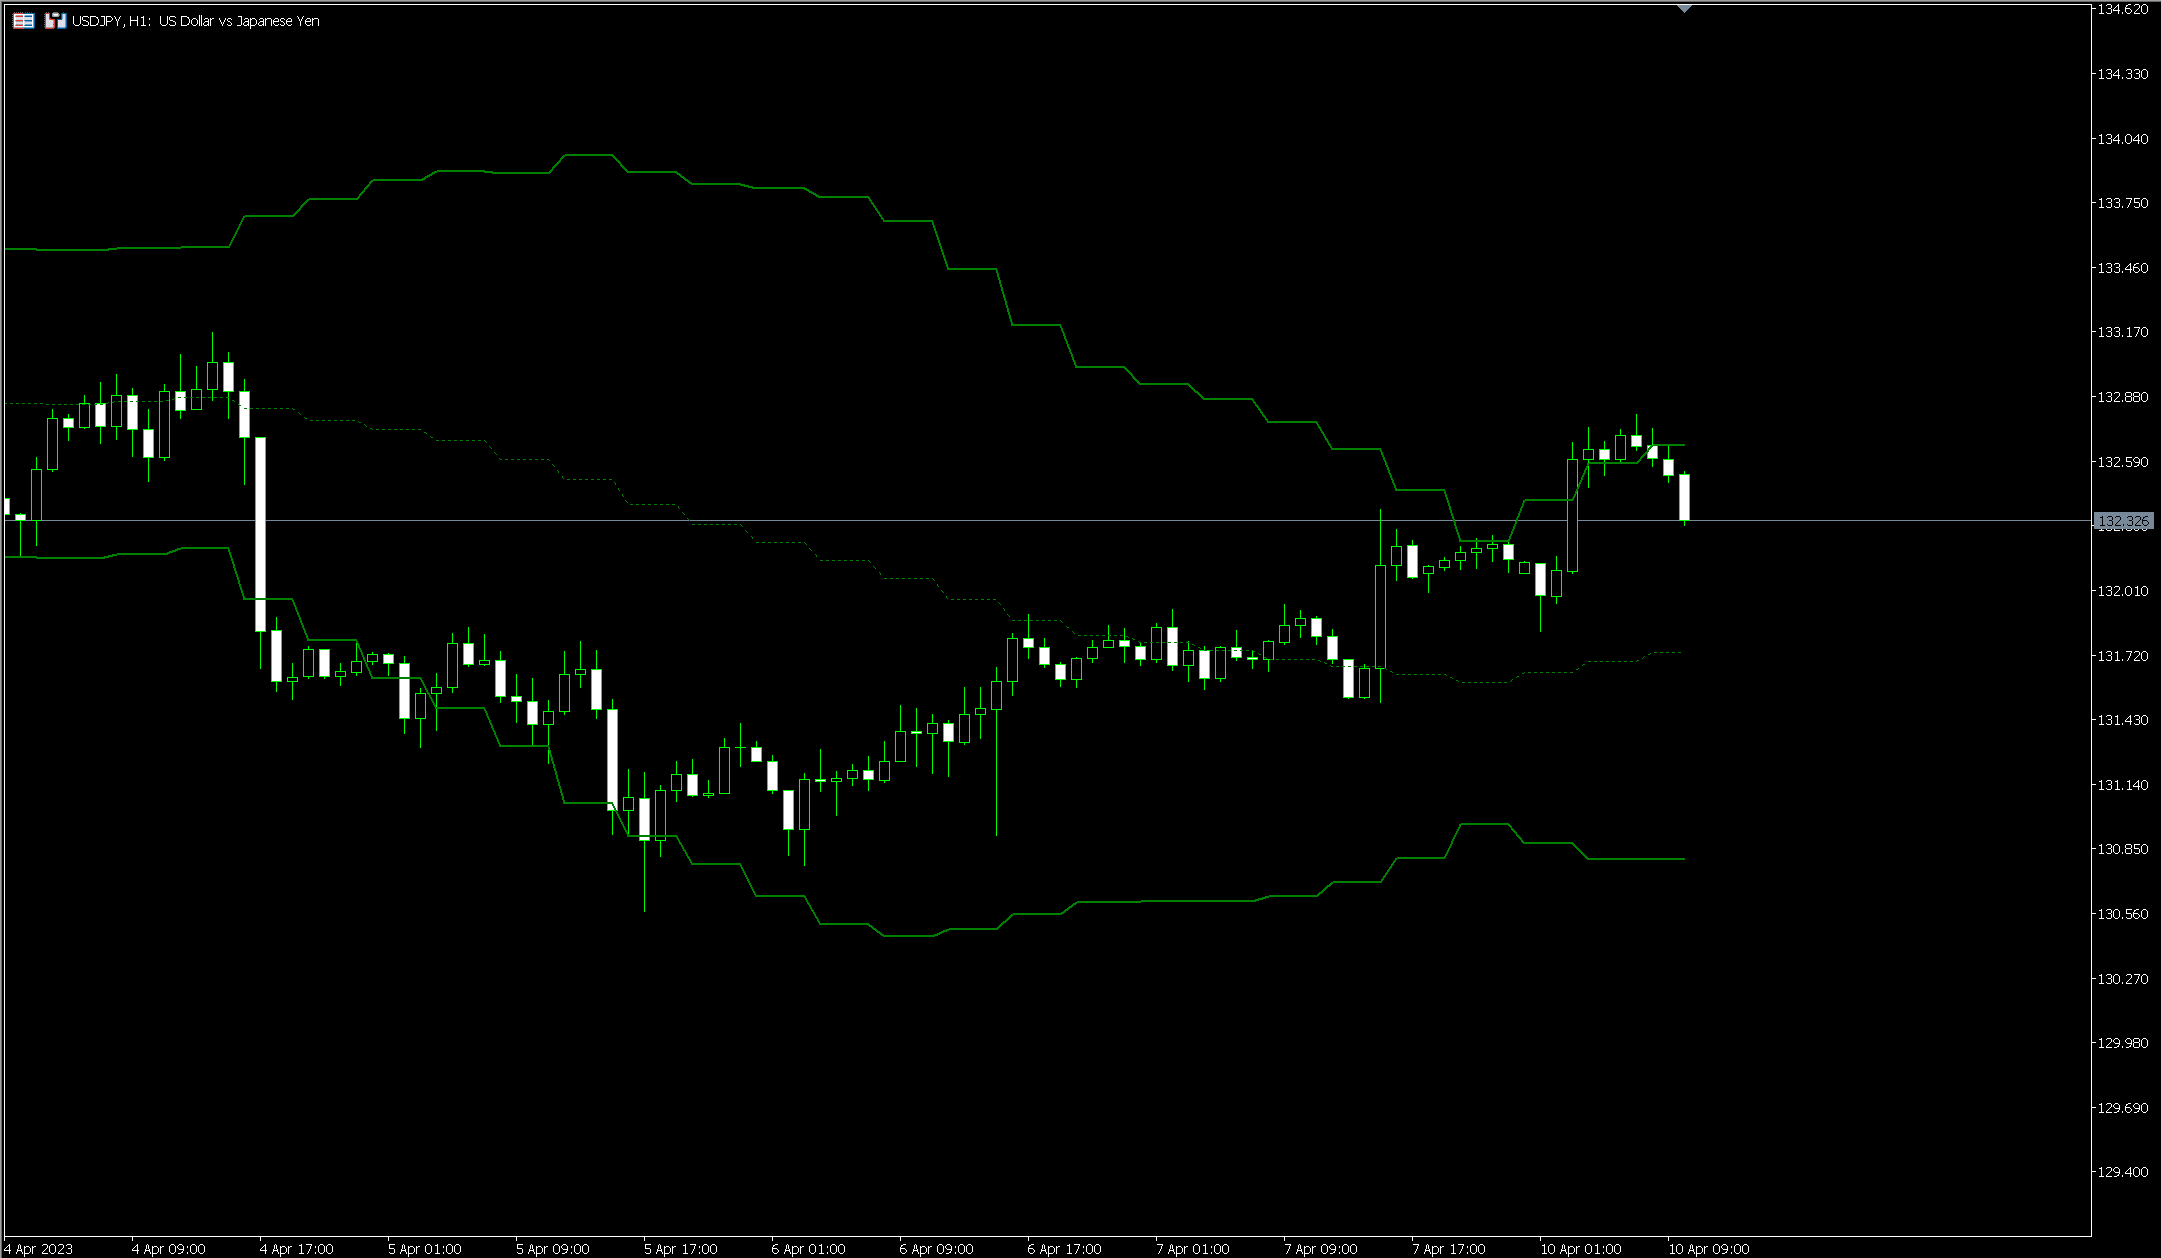
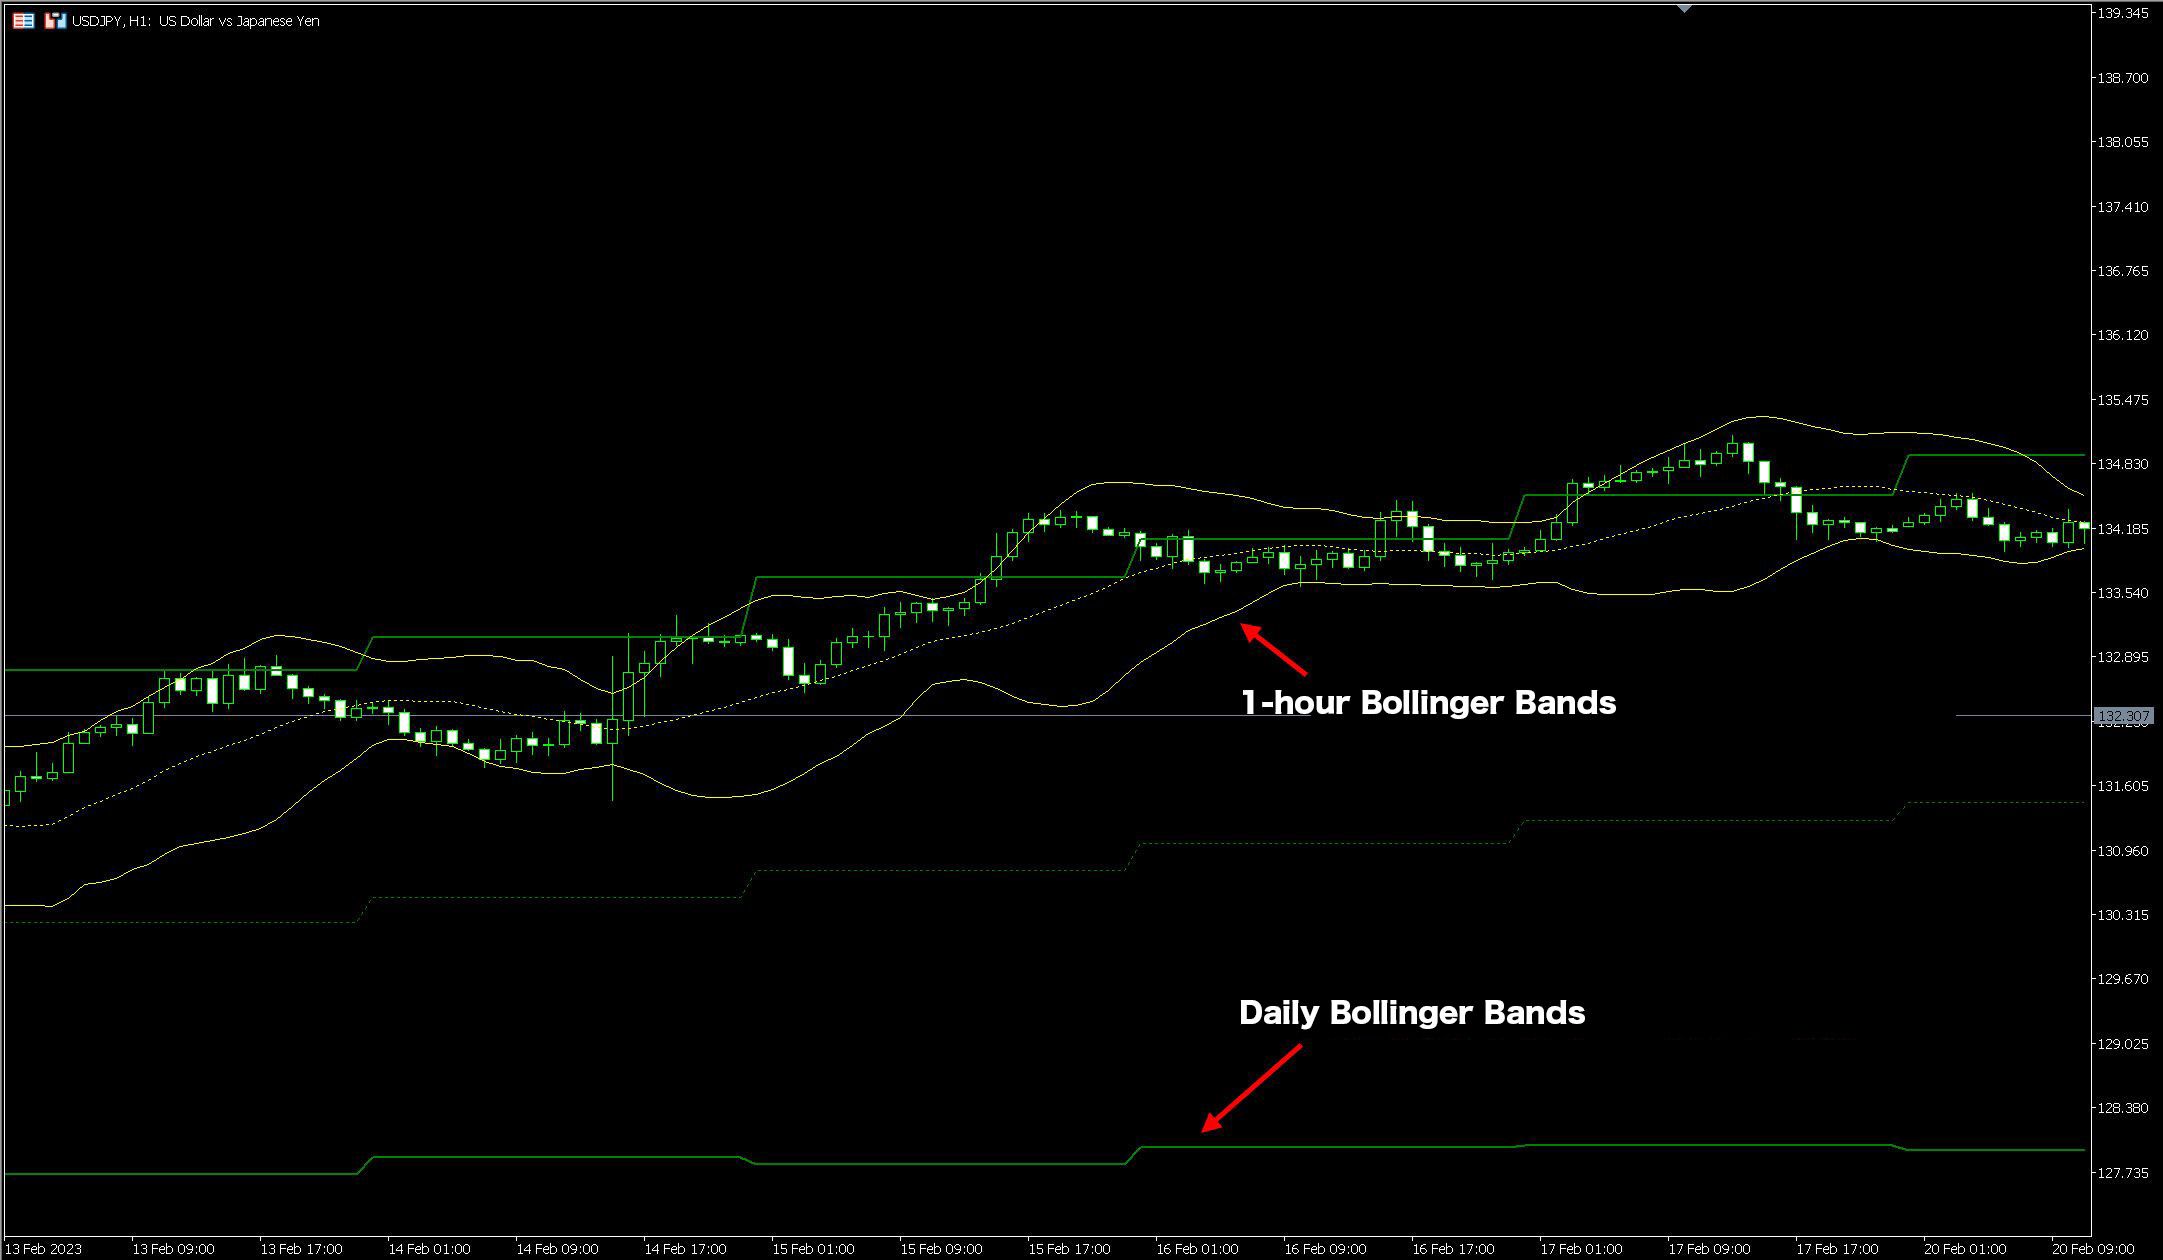
The Multi-Timeframe Bollinger Bands indicator allows for the display of Bollinger Bands not only for the chart's timeframe but also overlays longer timeframe Bollinger Bands.
For example, on a 1-hour chart, you can display Bollinger Bands for 4-hour and daily timeframes for enhanced analysis.
By checking the state of the Bollinger Bands for medium to long term, you can mitigate the risk of "missing the forest for the trees" during analysis.
【Example of displaying 1-hour Bollinger Bands (yellow) and daily Bollinger Bands (green) on a 1-hour chart】
What are Bollinger Bands?
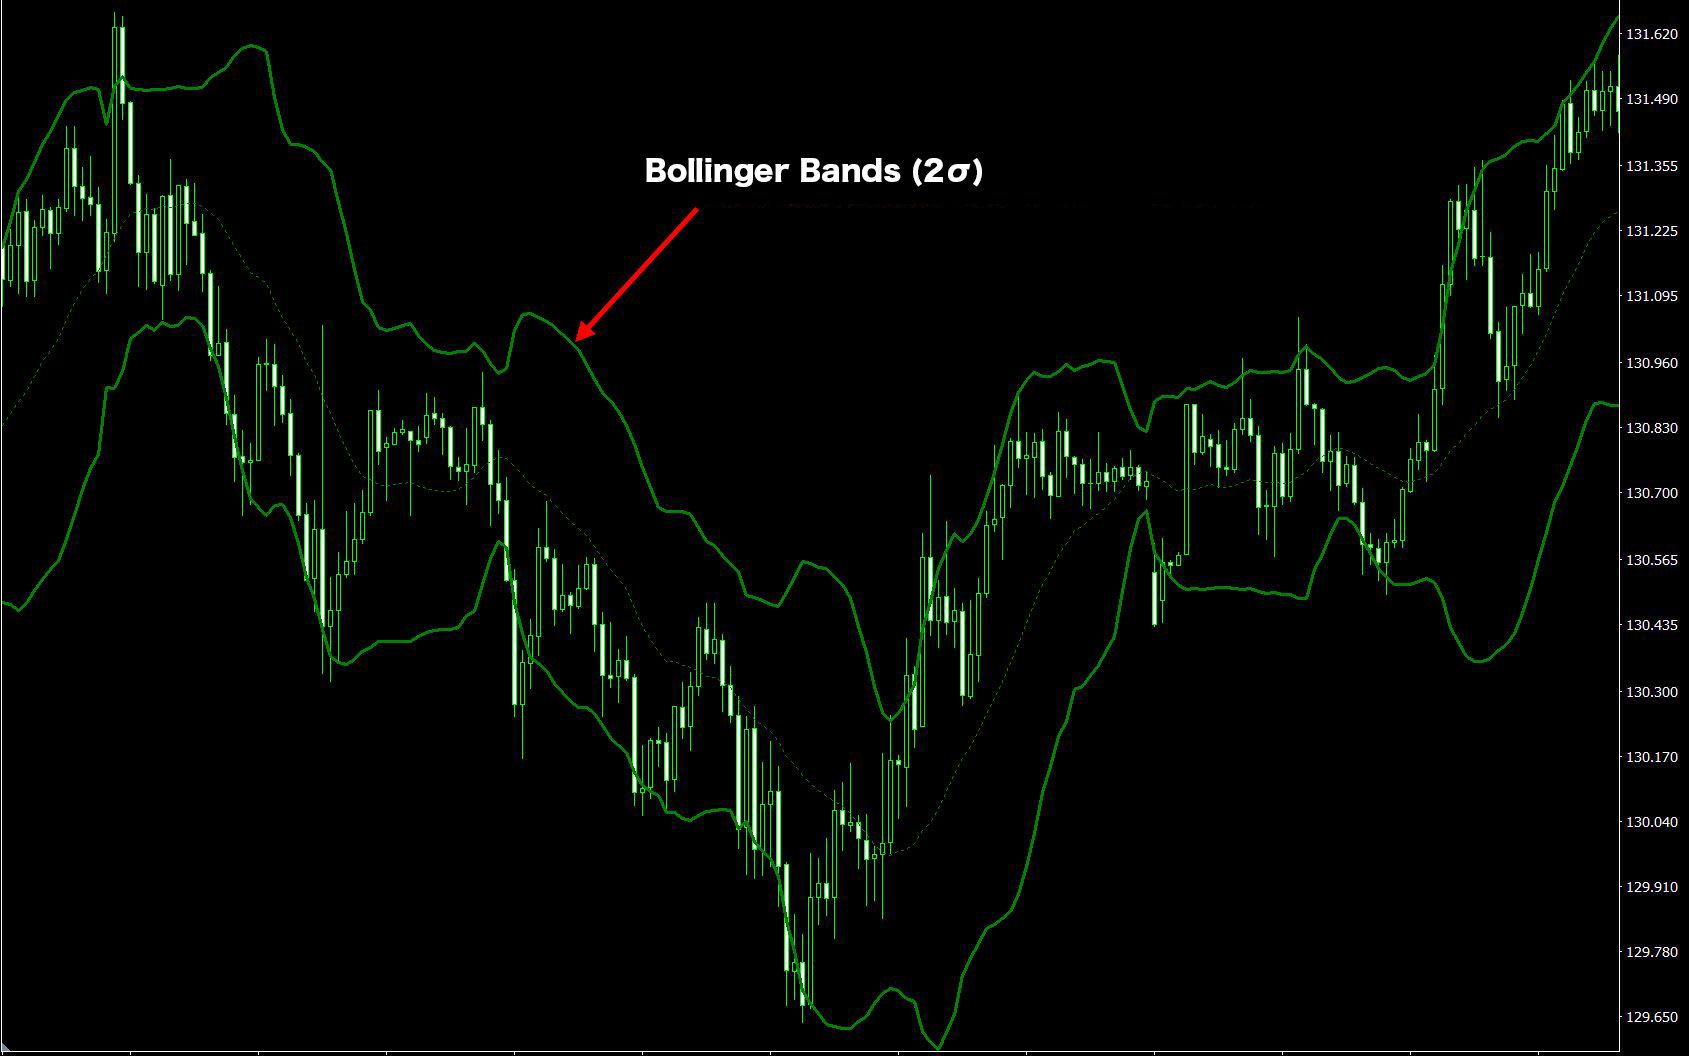
Bollinger Bands are indicators that plot lines at a certain number of standard deviations away from a moving average of the price.
The bands provide an analysis based on the probability of price movements remaining within these bands.
The probabilities of the price remaining within the bands are as follows:
Within 1 standard deviation (±1σ): about 68.3%
Within 2 standard deviations (±2σ): about 95.4%
Within 3 standard deviations (±3σ): about 99.7%
【Example of Bollinger Bands displayed with a standard deviation of 2】
Analysis with Bollinger Bands: Analyzing Trends
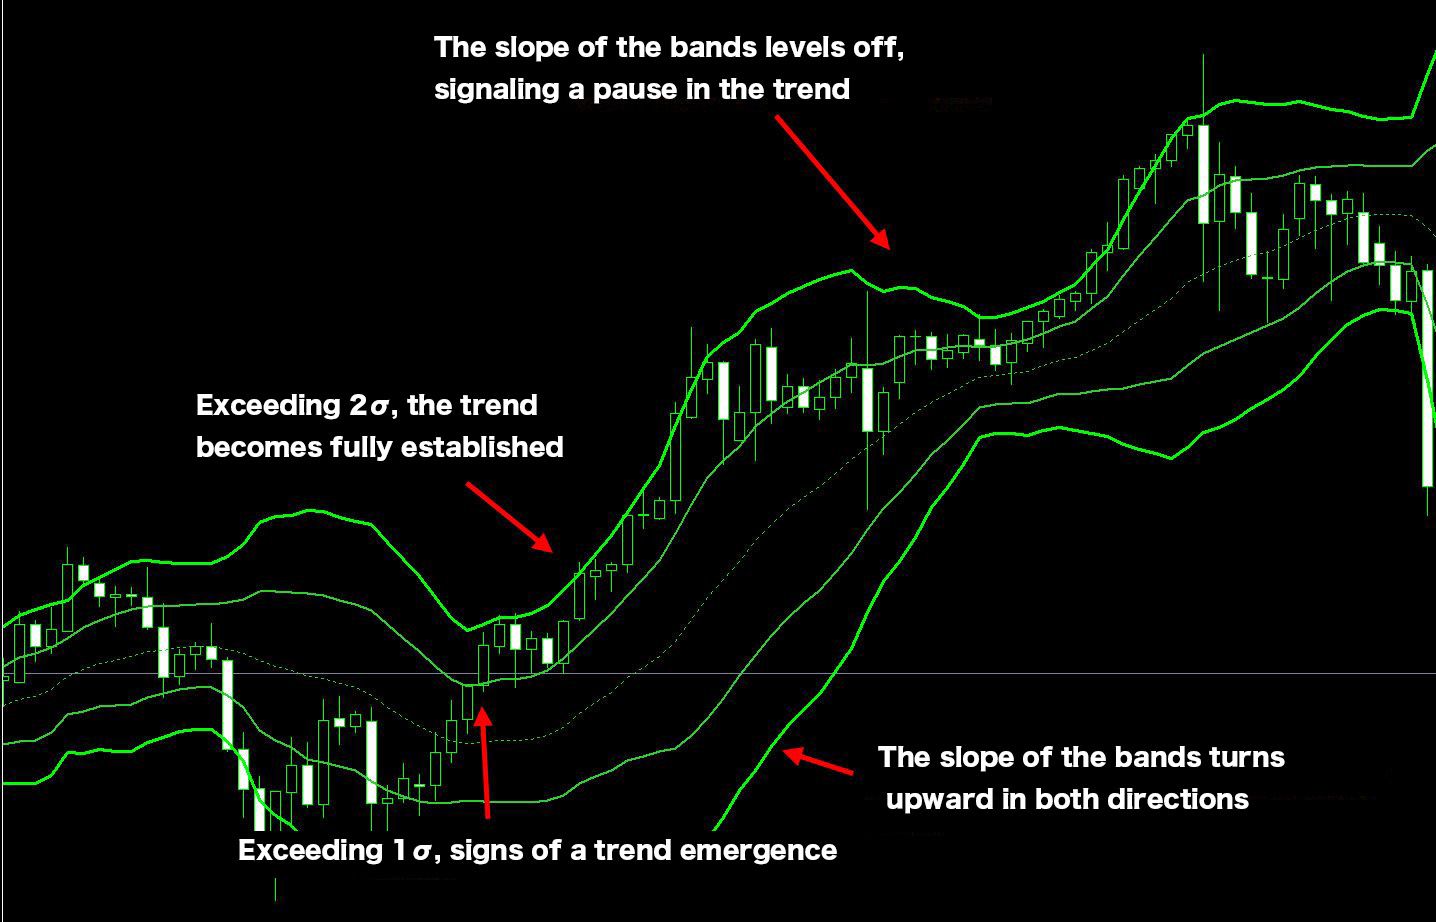
Bollinger Bands can be used to analyze the occurrence of trends.
When the price exceeds the 1 standard deviation band, it indicates a deviation from the moving average, suggesting the start of a trend.
If it exceeds the 2 standard deviation band, it suggests that the trend may be becoming more established.
Moreover, during an uptrend, the bands will angle upwards, and during a downtrend, they will angle downwards. By observing the direction of the bands, one can easily check the direction of the trend.
【Example of trend analysis using Bollinger Bands】
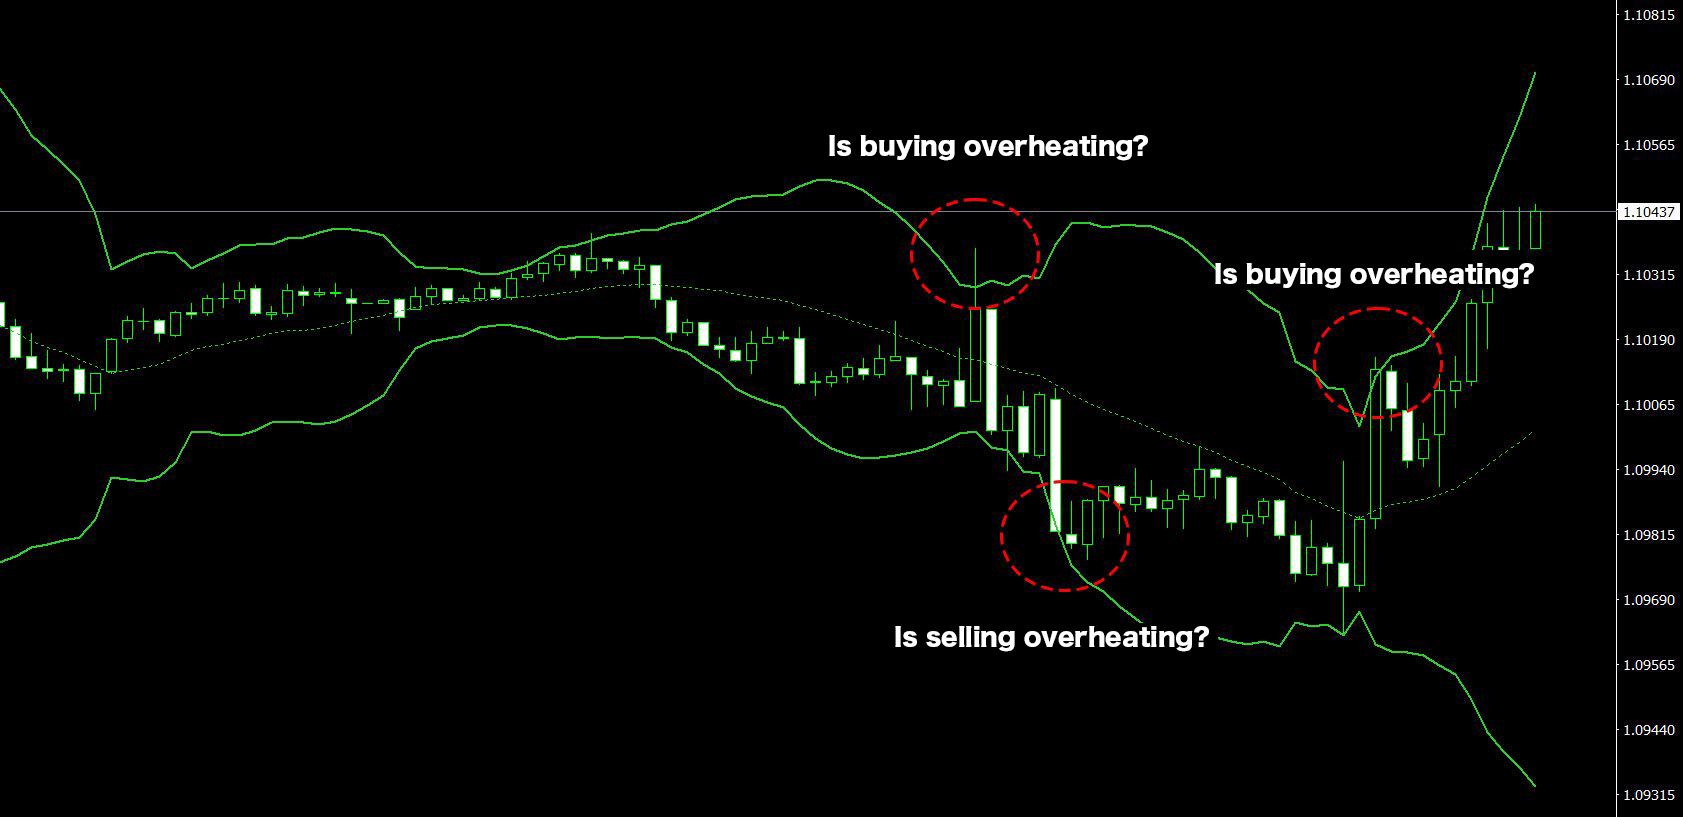
Analysis with Bollinger Bands: Analyzing Short-term Market Overheating
The probability of the price moving within the 2 and 3 standard deviations is 95.4% and 99.7%, respectively.
Therefore, if the price moves beyond 2 standard deviations, it may indicate the beginning of a trend, but it also suggests short-term market overheating.
If it exceeds 3 standard deviations, it is even less probable, indicating a highly overheated market state.
【Analysis of market overheating using Bollinger Bands (using 3 standard deviations)】
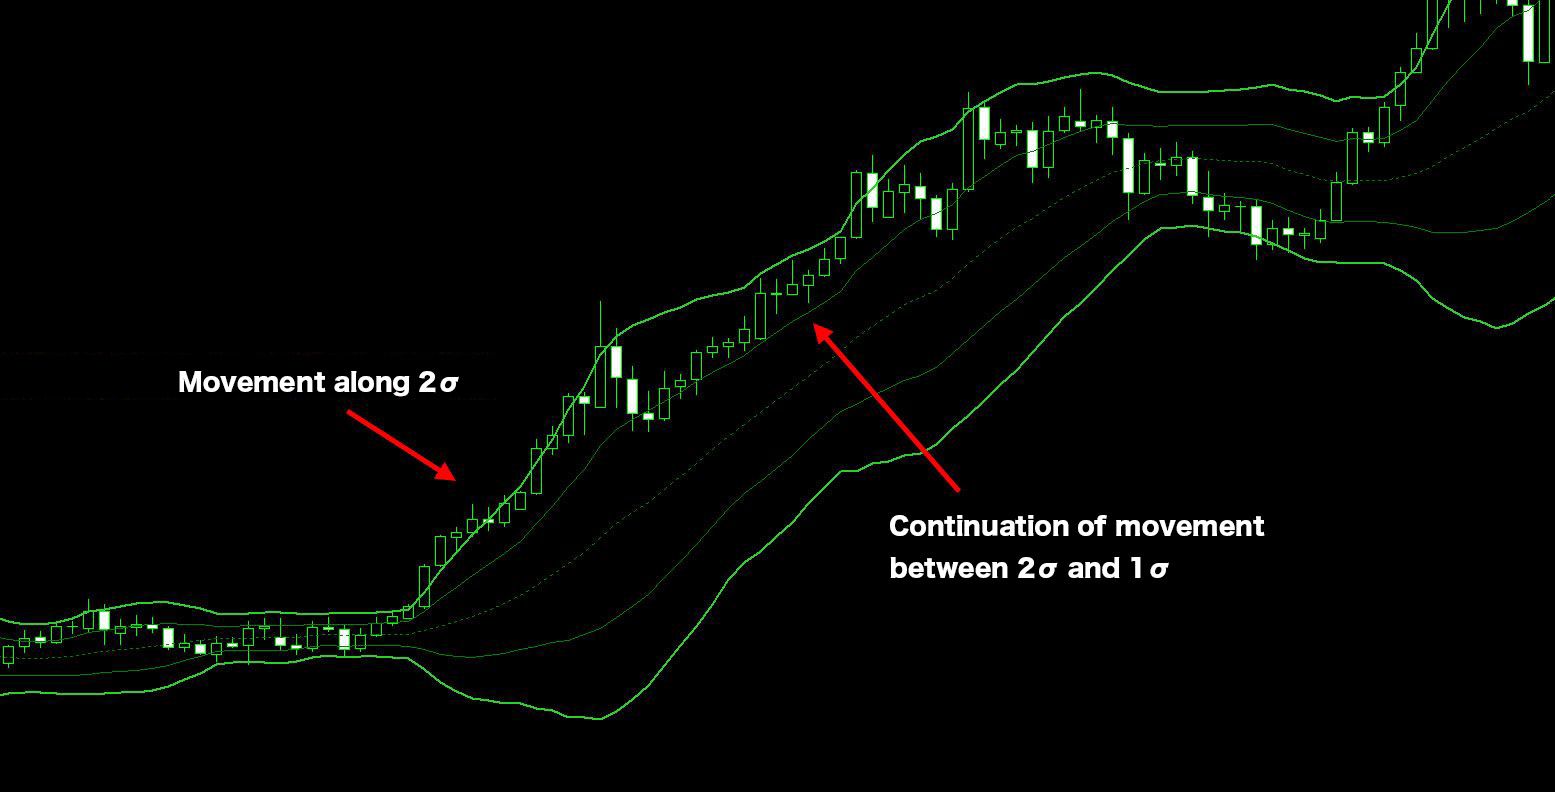
Band Walks during Trend Occurrences
When a trend occurs, the price may continue to move along or between the 1 and 2 standard deviation bands.
This condition is referred to as a "Band Walk" and is indicative of a strong trend state.
【Example of a Band Walk occurrence with Bollinger Bands】
※ This indicator only operates on the Windows version of MT5 and MT4 provided by TitanFX.
Indicator Terms of Use
Only those who agree to all the following items may use the indicators distributed on this website (https://research.titanfx.com):
1.The indicators and related descriptions are based on various data believed to be reliable, but their accuracy and completeness are not guaranteed.
2.The data displayed by the indicators do not guarantee your investment results. Also, the displayed content may vary due to market conditions and communication environments.
3.Please make investment decisions using indicators at your own risk. We are not responsible for any disadvantages or damages arising from the use of indicators.
4.Specifications of the indicators are subject to change without notice. Changes will be announced on the indicator description pages, etc.
5.Indicators should only be used by customers who have downloaded them. Transferring or selling the indicators to third parties is prohibited.
Indicator Settings
Input (MT5) or Parameter Entry (MT4) Tab Configuration
| Variable Name | Description | Default |
|---|---|---|
| Timeframe | Specifies which timeframe's Bollinger Bands to display. Selecting 'current' will display the chart's current timeframe. | current |
| Period | Specifies the period for the moving average. | 20 |
| Deviation | Specifies the value for the standard deviation, selectable from 1 to 3. | 2 |
| Shift | Used to shift the display position left or right. Positive integers shift it right, negative integers shift it left. | 0 |
| MA method | Chooses the type of moving average for the center line. Options include Simple (SMA), Exponential (EMA), Smoothed (SMMA), and Linear Weighted (LWMA). | Simple |
| Price field | Specifies the price to be used. | Close price |
Color (MT5) or Color Settings (MT4) Tab Configuration
| MT5 | MT4 | Description |
|---|---|---|
| Bands MA | 0 | Color, thickness, and type of the center moving average line |
| Bands Upper | 1 | Color, thickness, and type of the upper line |
| Bands Lower | 2 | Color, thickness, and type of the lower line |