Multi-Timeframe MACD (Titan_Multi_MACD)

Indicator Overview
Displaying Multi-Timeframe MACD
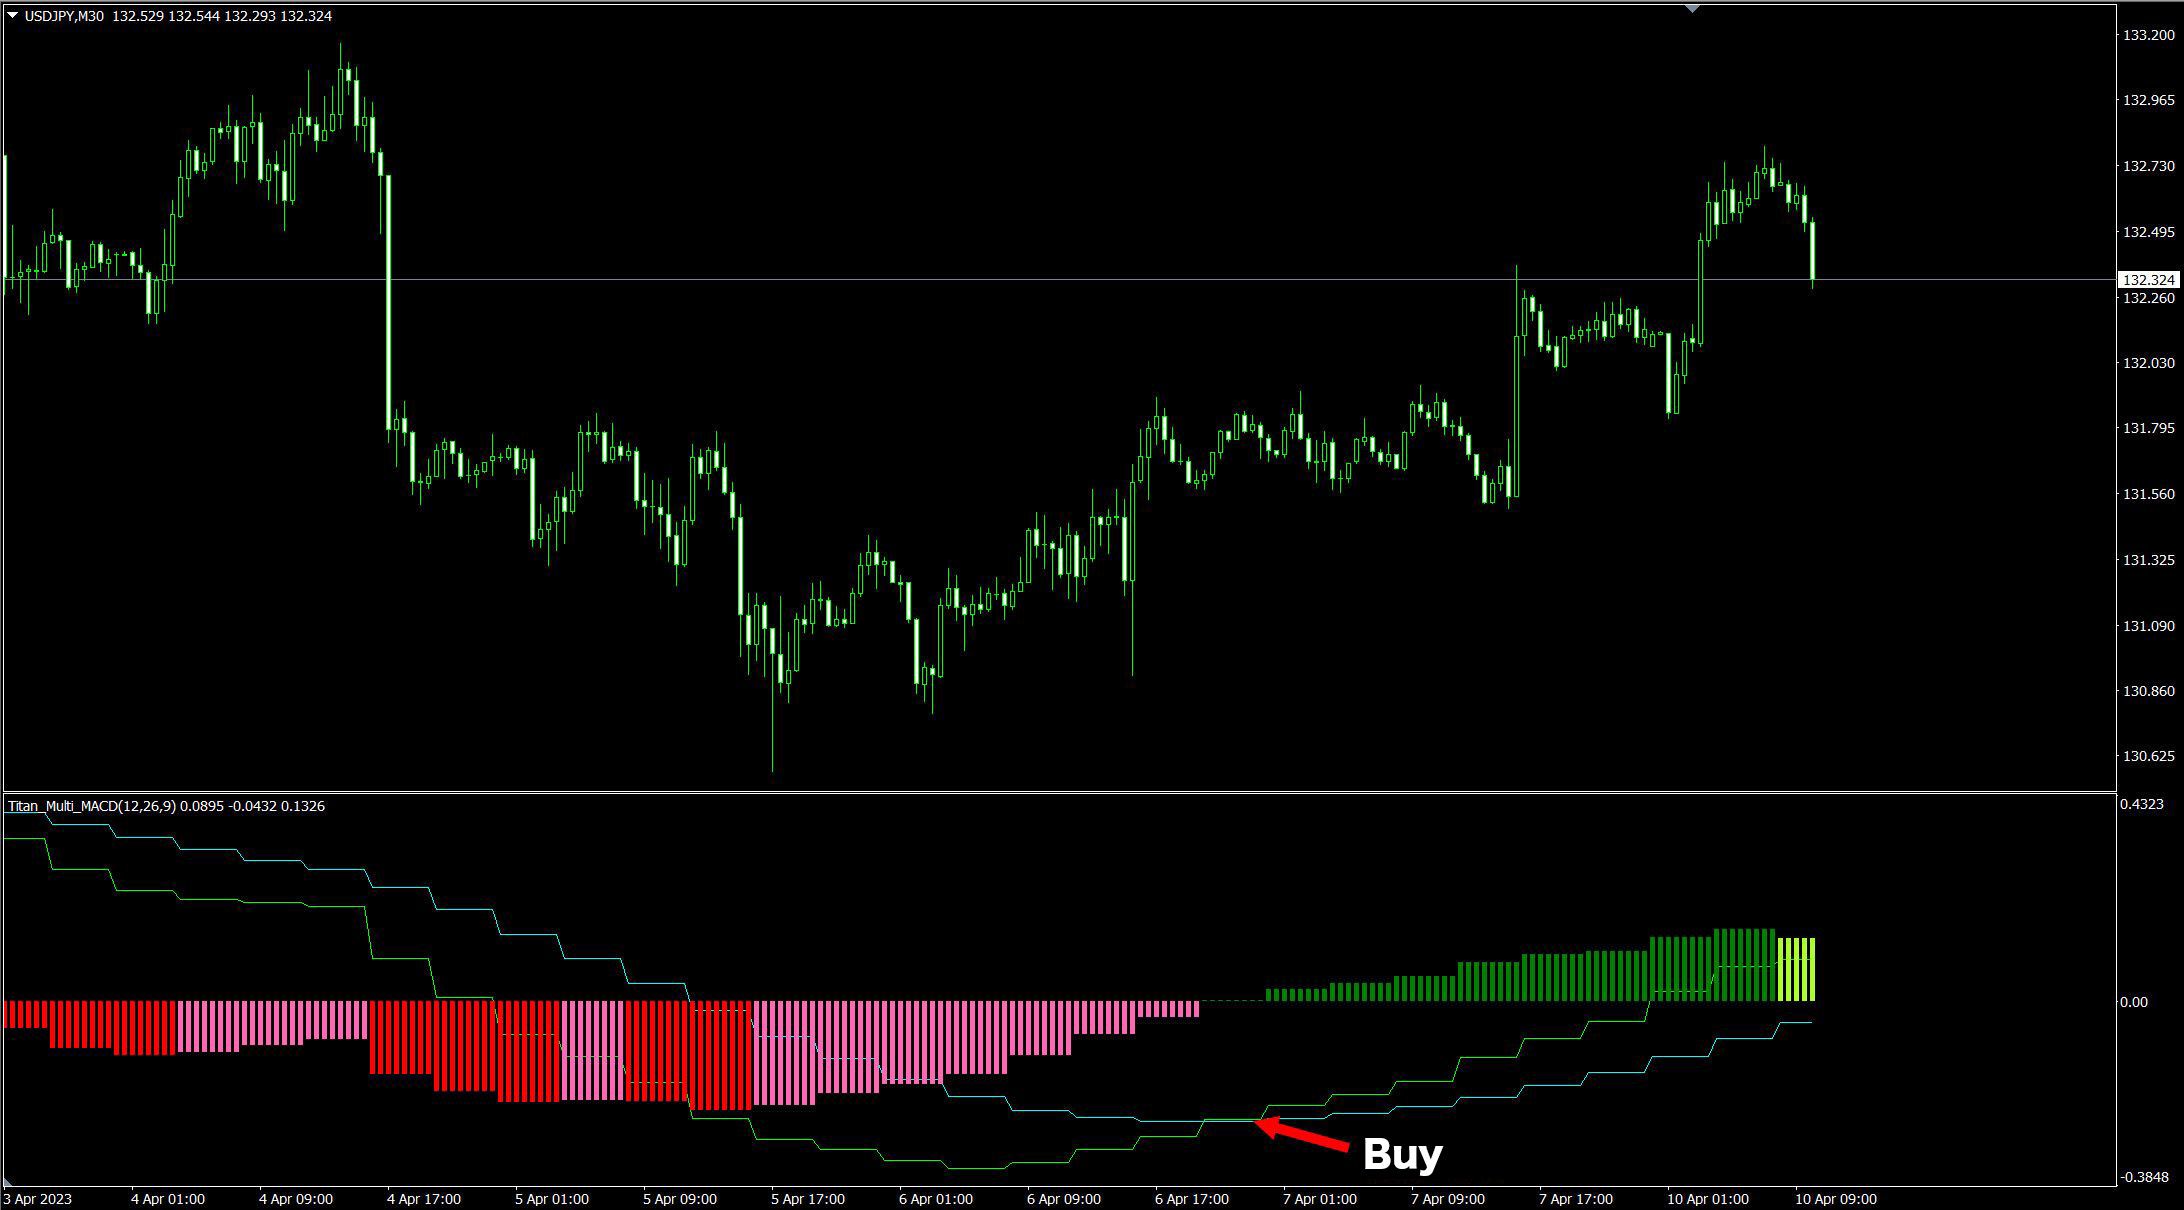
The Multi-Timeframe MACD indicator can display the MACD not only for the chart's timeframe but also from longer timeframes. This indicator also shows the histogram of the difference between the MACD and its signal line, which is not available in the default MACD on MT4 and MT5.
Additionally, the histogram changes color based on the increase or decrease from the previous bar, allowing for the detection of subtle changes.
【Example of Displaying 4-Hour MACD on a 30-Minute Chart】
What is MACD?
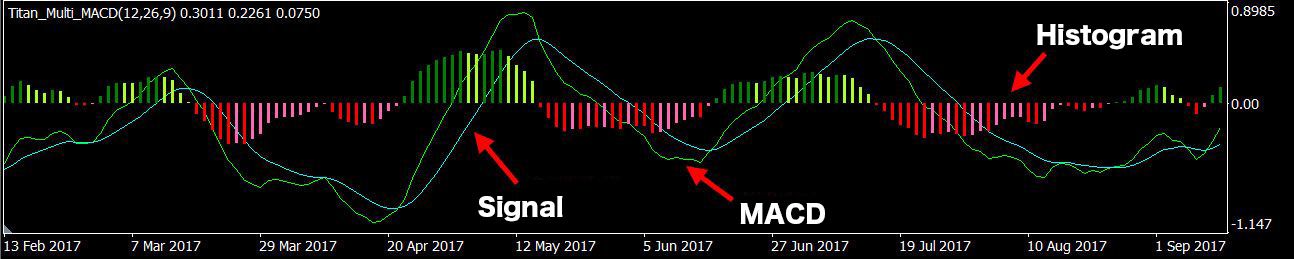
MACD, or Moving Average Convergence Divergence, is an indicator that displays the difference between a short-term EMA (Exponential Moving Average) and a long-term EMA on a subchart. It is common to overlay the MACD with a signal line, which is the moving average of the MACD.
Unlike the default MACD in MT4 and MT5, this indicator displays the difference between the MACD and the signal as a histogram. The histogram is shown in four different colors based on whether it is positive or negative and increasing or decreasing, allowing for detailed tracking of changes between the MACD and the signal line.
There are fundamentally two trading signals with MACD:
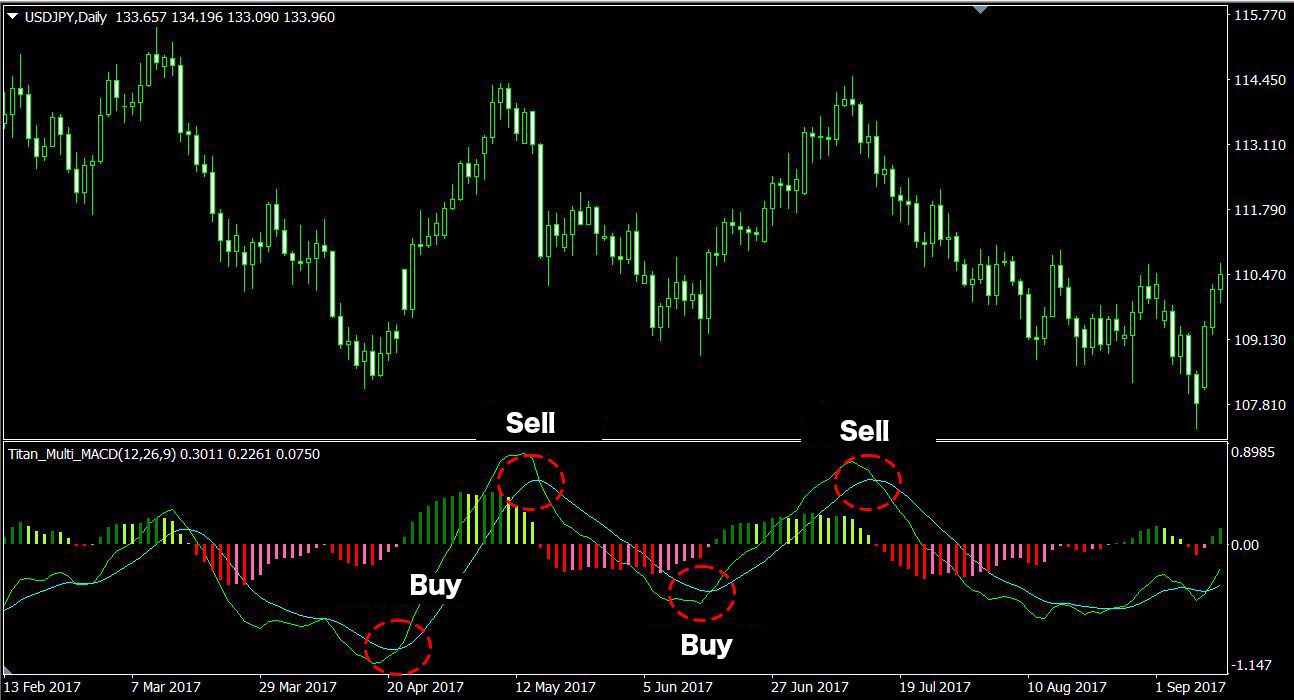
MACD Buy/Sell Signals #1: MACD and Signal Crossover
A sell signal is generated when the MACD crosses below the signal line above zero, and a buy signal is generated when the MACD crosses above the signal line below zero.
【Example of MACD and Signal Crossover】
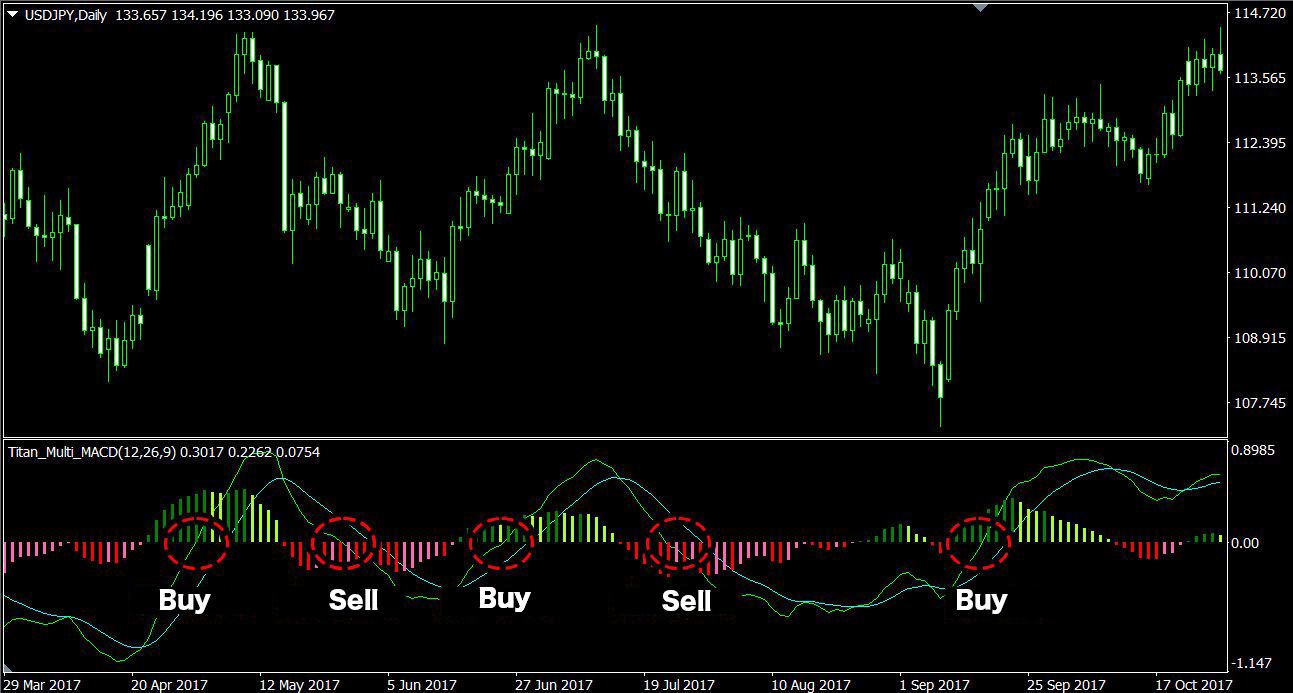
MACD Buy and Sell Signals #2: MACD and Zero Crossover
A buy signal occurs when the MACD crosses above zero, and a sell signal occurs when it crosses below zero. This corresponds to a golden cross or death cross in EMA.
【Example of MACD and Zero Crossover】
※ This indicator is only compatible with TitanFX's Windows version of MT5 and MT4.
Indicator Terms of Use
Only those who agree to all the following items may use the indicators distributed on this website (https://research.titanfx.com):
1.The indicators and related descriptions are based on various data believed to be reliable, but their accuracy and completeness are not guaranteed.
2.The data displayed by the indicators do not guarantee your investment results. Also, the displayed content may vary due to market conditions and communication environments.
3.Please make investment decisions using indicators at your own risk. We are not responsible for any disadvantages or damages arising from the use of indicators.
4.Specifications of the indicators are subject to change without notice. Changes will be announced on the indicator description pages, etc.
5.Indicators should only be used by customers who have downloaded them. Transferring or selling the indicators to third parties is prohibited.
Indicator Settings
Input (For MT5), Parameter Input (For MT4)
| Variable Name | Description | Default |
|---|---|---|
| Timeframe | Specifies which timeframe's MACD to display. Select 'current' to display the chart's timeframe. | current |
| Shoet term | Specifies the period for the short-term moving average used in calculating MACD. | 12 |
| Long term | Specifies the period for the long-term moving average used in calculating MACD. | 26 |
| Time period for the calculation | Specifies the period for the long-term moving average used in calculating MACD. | 9 |
| Moving average type | Specifies the type of moving average: Simple (SMA), Exponential (EMA), Smoothed (SMMA), Linear Weighted (LWMA). | Exponential |
| Applied price | Specifies the price to be used. | Close price |
Color Settings (For MT5), Color Configuration (For MT4)
| MT5 | MT4 | Description |
|---|---|---|
| MACD | 0 | Color, thickness, and style of the MACD line |
| Signal | 1 | Color, thickness, and style of the signal line |
| 2 | 2 | Color and thickness when the histogram is positive and has increased from the previous bar |
| 3 | 3 | Color and thickness when the histogram is positive and has decreased from the previous bar |
| 4 | 4 | Color and thickness when the histogram is negative and has decreased from the previous bar |
| 5 | 5 | Color and thickness when the histogram is negative and has increased from the previous bar |