Pivot (Titan_pivot)
Indicator Overview
What is a Pivot?
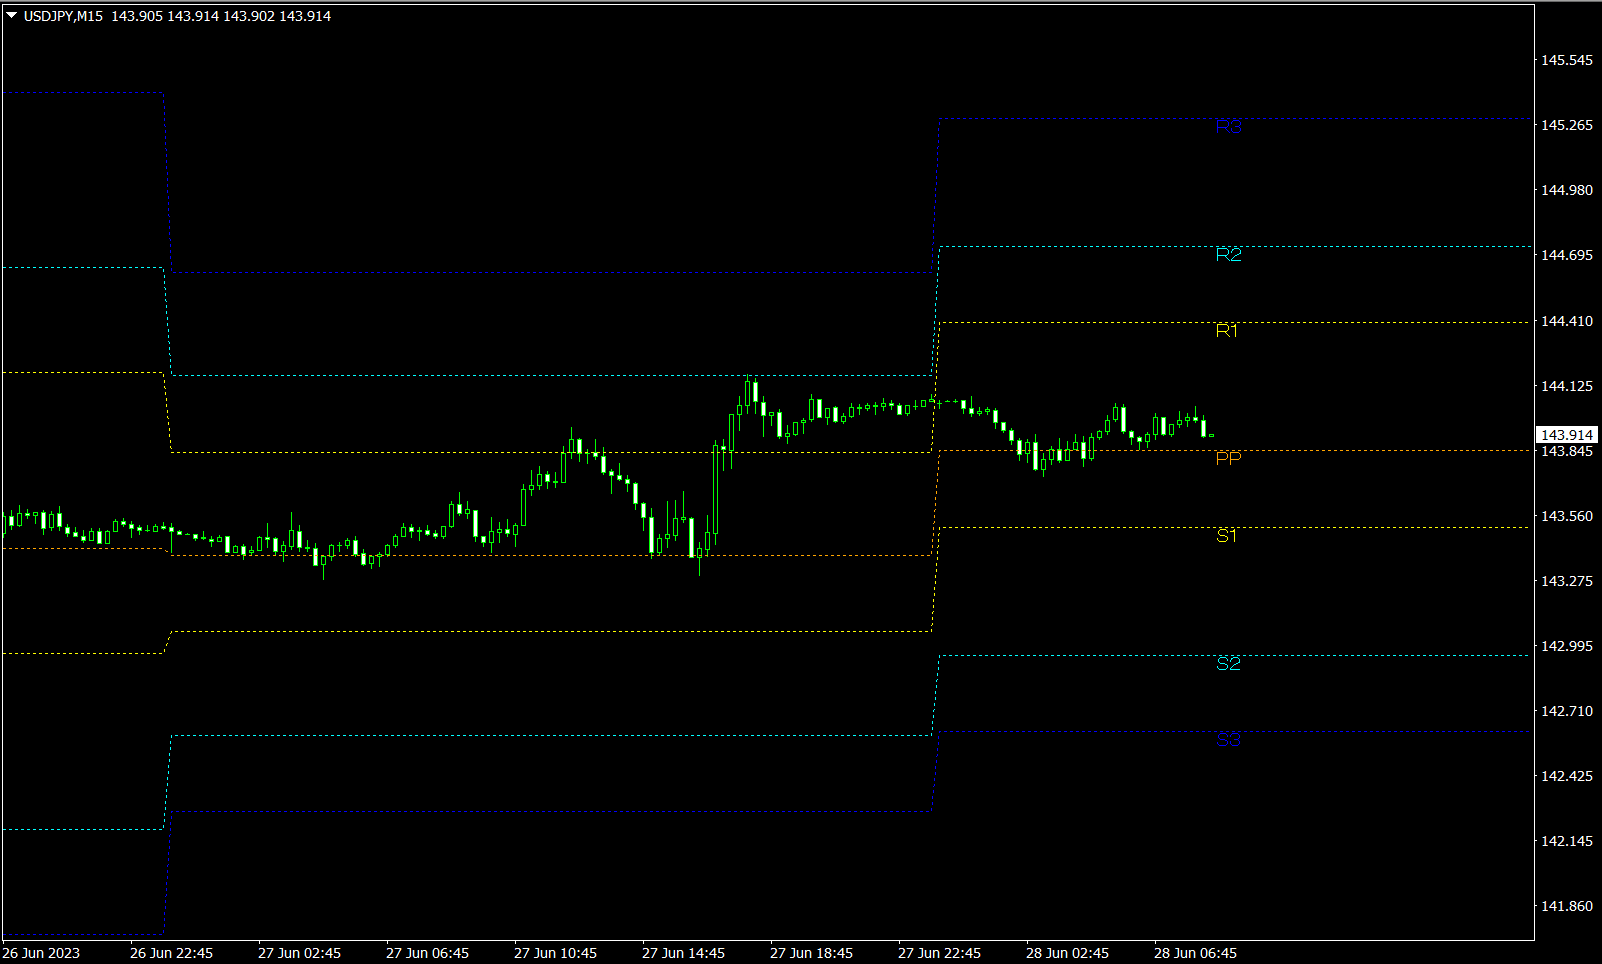
A pivot uses seven levels calculated from the previous day's high, low, and close prices—PP, R1, R2, R3, S1, S2, and S3—to analyze the market. Generally, R1 to R3 are considered resistance levels and S1 to S3 as support levels, but these can also help assess the momentum of the trend.
The pivot levels are calculated as follows:
PP (Pivot Point) = (Previous High + Previous Low + Previous Close) / 3
S1 = PP - (Previous High - PP)
S2 = PP - (Previous High - Previous Low)
S3 = S1 - (Previous High - Previous Low)
R1 = PP + (PP - Previous Low)
R2 = PP + (Previous High - Previous Low)
R3 = R1 + (Previous High - Previous Low)
【Example of Pivot Display】
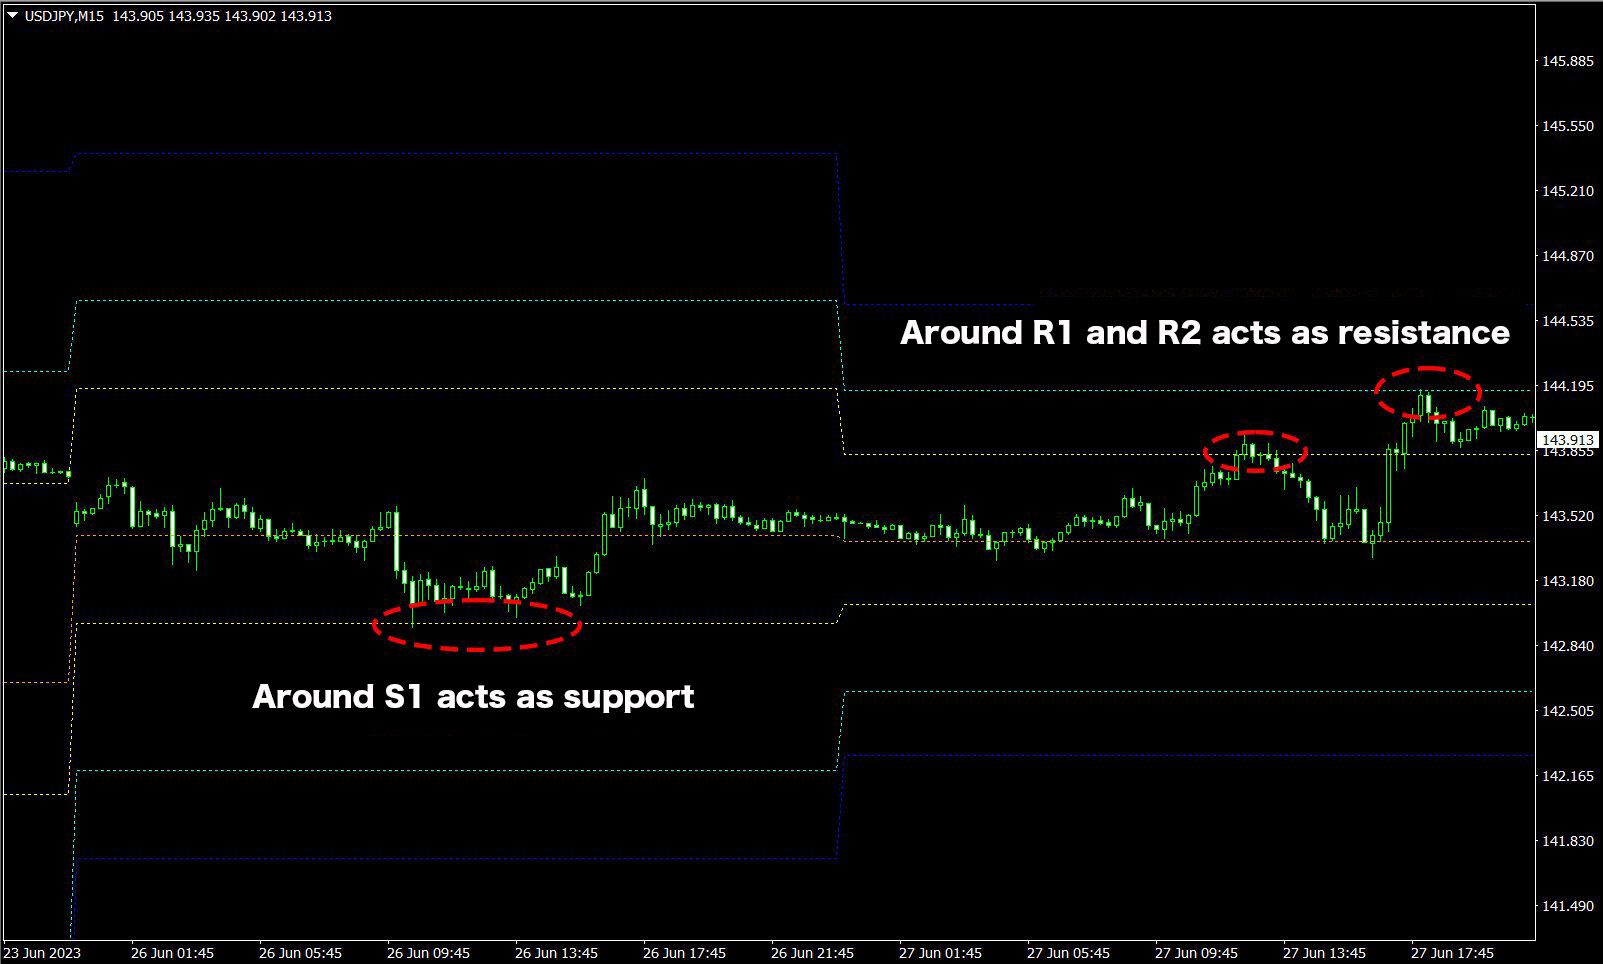
Useful for Short-Term Traders for Profit Taking and Contrarian Entries
Pivots are levels often watched by day traders and other short-term traders. Thus, these pivot levels frequently act as resistance or support during the day.
They are commonly used to set profit-taking levels or for determining entry points for contrarian trades.
【Example of Pivot Acting as Resistance and Support】
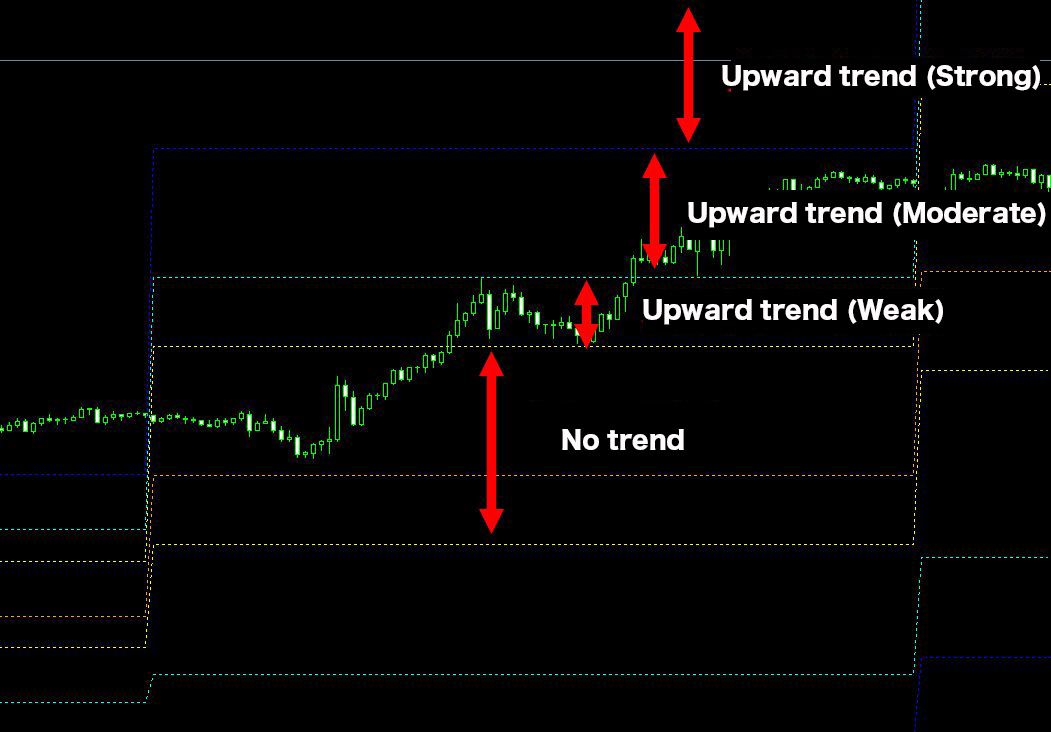
Analyzing Trend Strength Based on Price Levels
The relationship between the pivot levels and the price can indicate the strength of a trend. For instance, a price movement between R1 and R2 suggests less momentum compared to movement between R2 and R3.
A break above R3 may indicate a strong upward trend.
【Example of Analysis Using Pivot】
※ This indicator is only compatible with TitanFX's Windows version of MT5 and MT4.
Indicator Terms of Use
Only those who agree to all the following items may use the indicators distributed on this website (https://research.titanfx.com):
1.The indicators and related descriptions are based on various data believed to be reliable, but their accuracy and completeness are not guaranteed.
2.The data displayed by the indicators do not guarantee your investment results. Also, the displayed content may vary due to market conditions and communication environments.
3.Please make investment decisions using indicators at your own risk. We are not responsible for any disadvantages or damages arising from the use of indicators.
4.Specifications of the indicators are subject to change without notice. Changes will be announced on the indicator description pages, etc.
5.Indicators should only be used by customers who have downloaded them. Transferring or selling the indicators to third parties is prohibited.
Indicator Settings
Input (For MT5), Parameter Input (For MT4)
| Input (For MT5), Parameter Input (For MT4) | Description | Default |
|---|---|---|
| Timeframe | Specifies the timeframe for calculating the Pivot. Typically, the daily (D1) timeframe is used. | D1 |
| Maxmun bars | Specifies the number of bars to display. | 1000 |
Color Settings (For MT5), Color Configuration (For MT4)
| MT5 | MT4 | Description |
|---|---|---|
| 0 | 0 | Color, thickness, and style of the R3 line |
| 1 | 1 | Color, thickness, and style of the R2 line |
| 2 | 2 | Color, thickness, and style of the R1 line |
| 3 | 3 | Color, thickness, and style of the PP line |
| 4 | 4 | Color, thickness, and style of the S1 line |
| 5 | 5 | Color, thickness, and style of the S2 line |
| 6 | 6 | Color, thickness, and style of the S3 line |