RCI(Titan_RCI)
Indicator Overview
Understanding Trends Through the Correlation of Price and Time Rankings
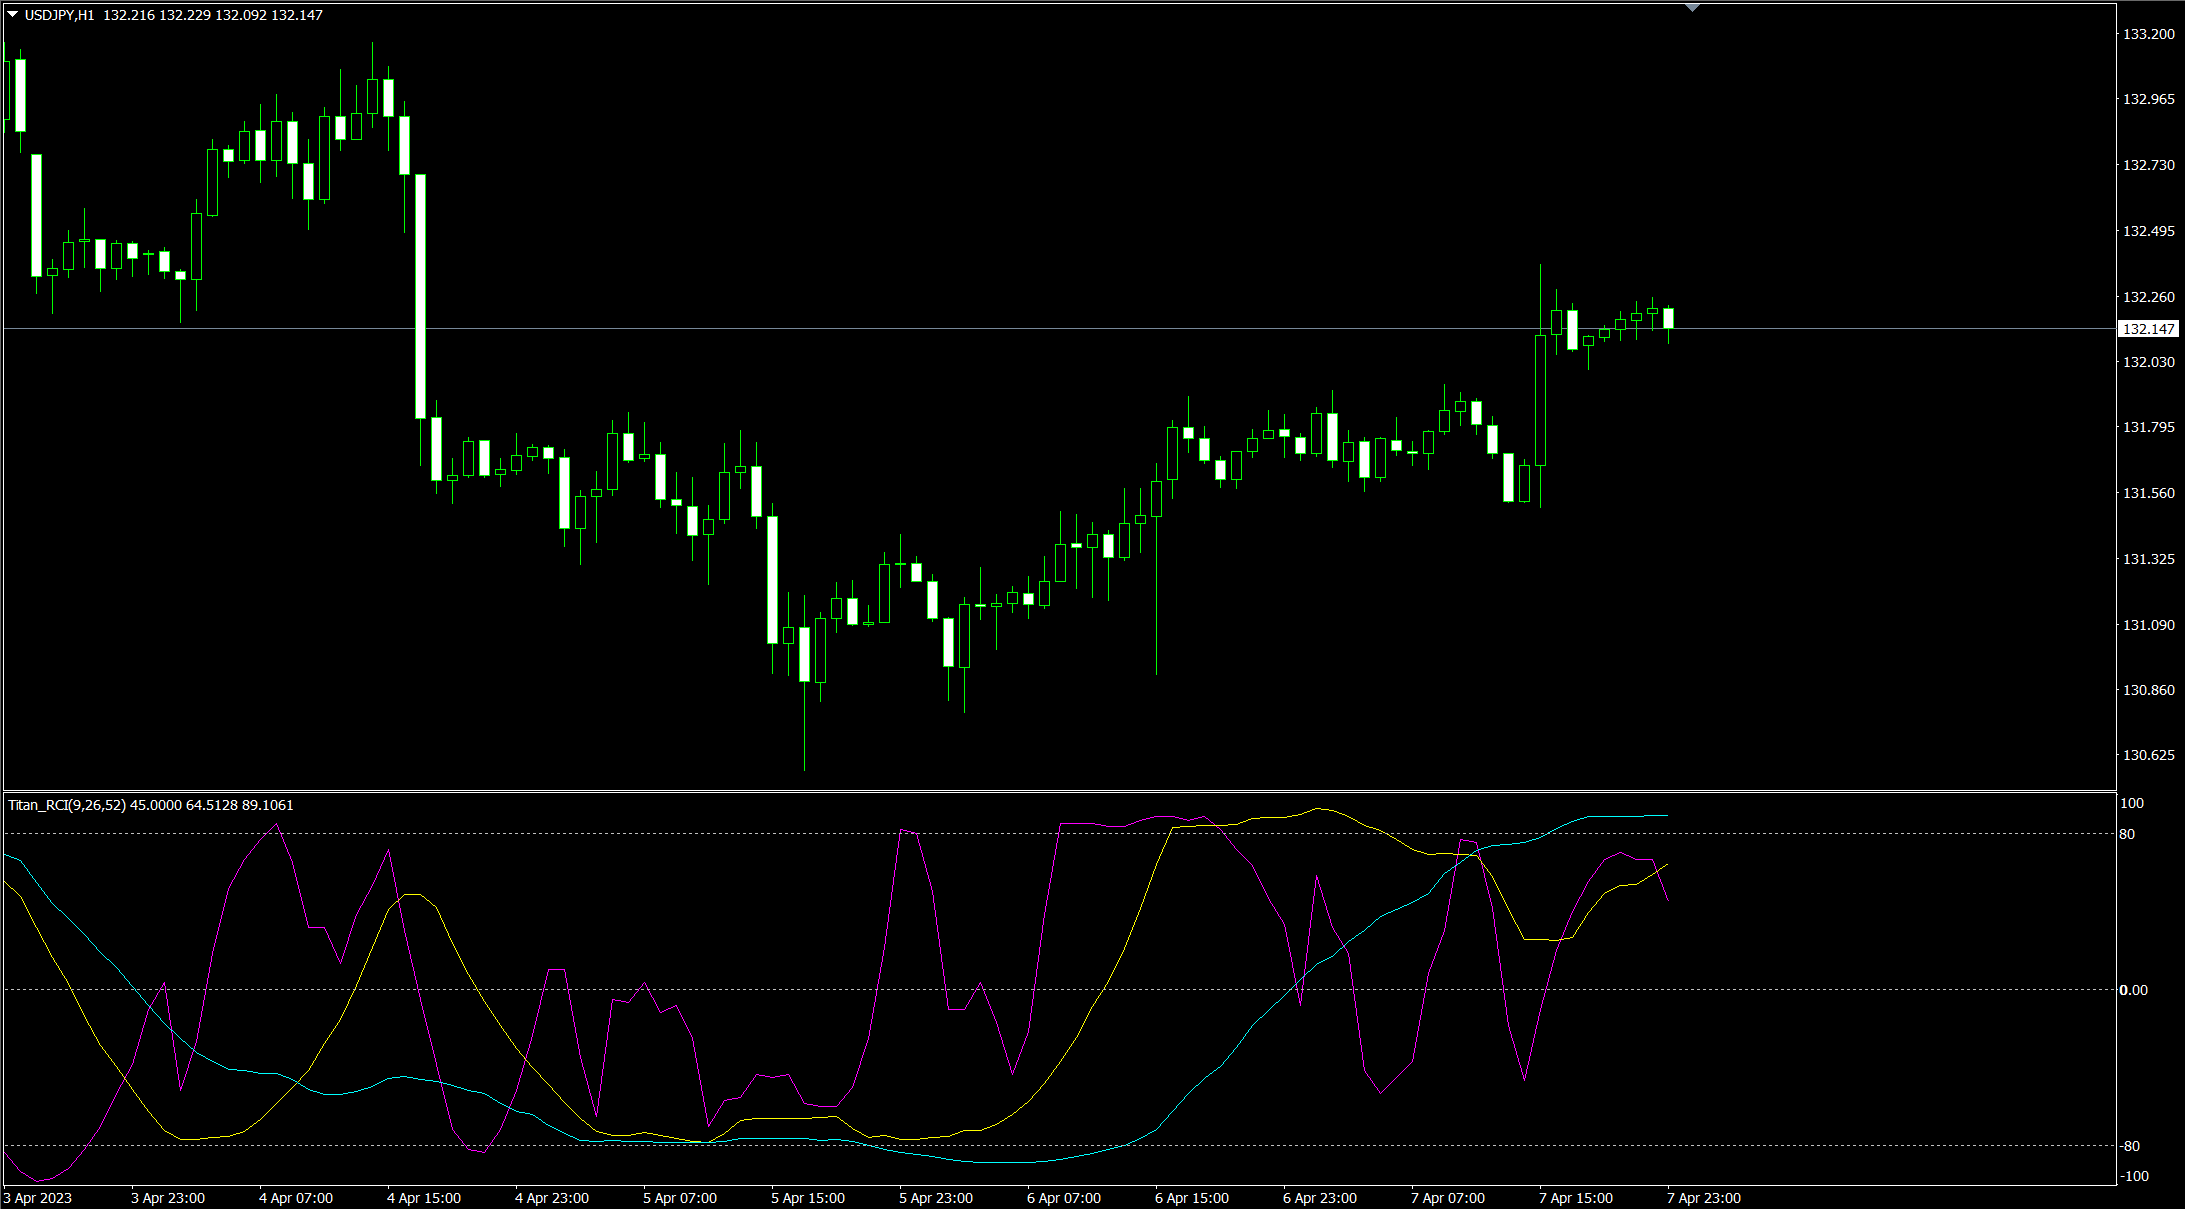
RCI (Rank Correlation Index) is an indicator that displays the correlation between the rank of prices (in descending order) and the rank of time (from most recent). It shows the correlation coefficient between these two ranks on a scale from -100 to 100.
A correlation coefficient closer to 100 indicates a high positive correlation, while a coefficient near -100 indicates a high negative correlation. Therefore, a coefficient near 100 suggests that as time progresses, prices are trending upwards, indicating an upward trend. Conversely, a coefficient near -100 indicates that prices are falling as time progresses, suggesting a downward trend.
Analyzing with Three RCI Lines
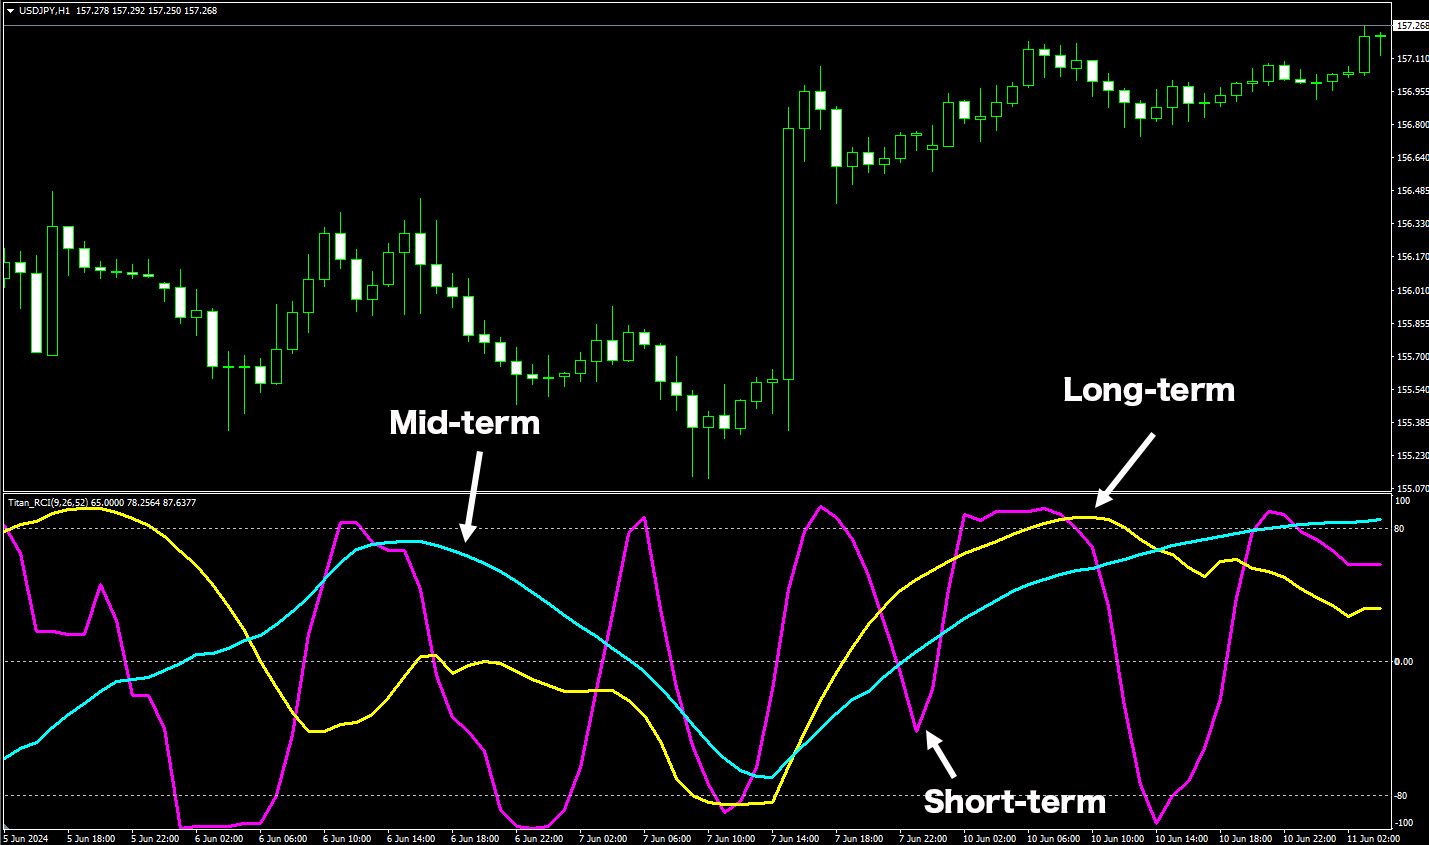
This indicator allows the display of three RCI lines: short-term, medium-term, and long-term, each based on different measurement periods. This facilitates the analysis of both medium to long-term trends and the momentum of recent prices.
【Example of Displaying Three RCI Lines】
RCI Focus Point #1: Monitor the ±80 Level to Identify Trend Reversals
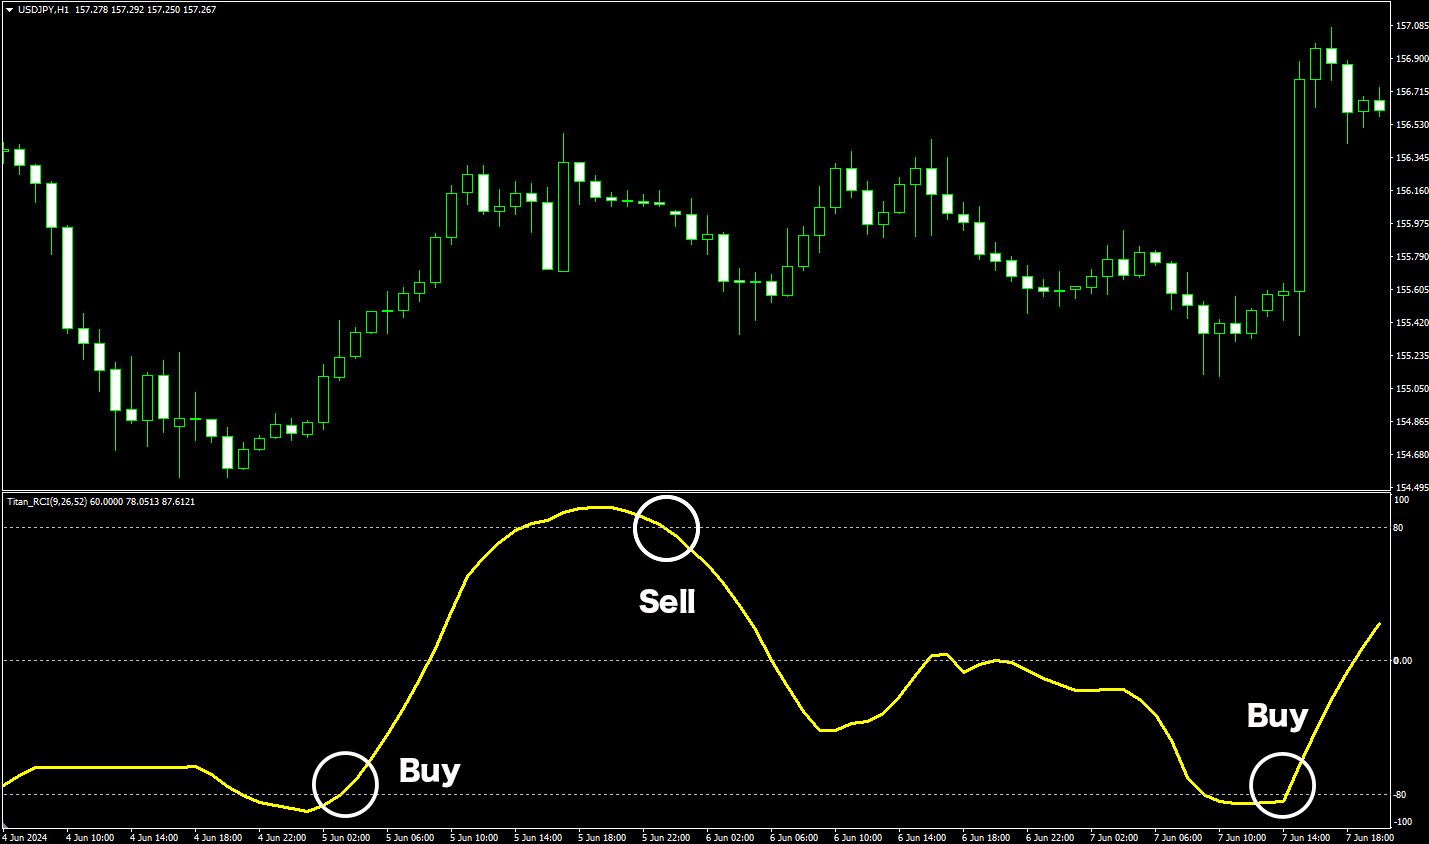
When the RCI line crosses above or below the ±80 level, it indicates that a trend has developed in either direction. If after exceeding the ±80 level, the RCI returns below this threshold, it suggests that the trend may have peaked and a reversal could be imminent, providing a potential trading signal.
【Example of Analysis Using One RCI Line (Only Period 26 Displayed)】
RCI Focus Point #2: Identify Trend Reversals Through the Crossover of Different RCI Periods
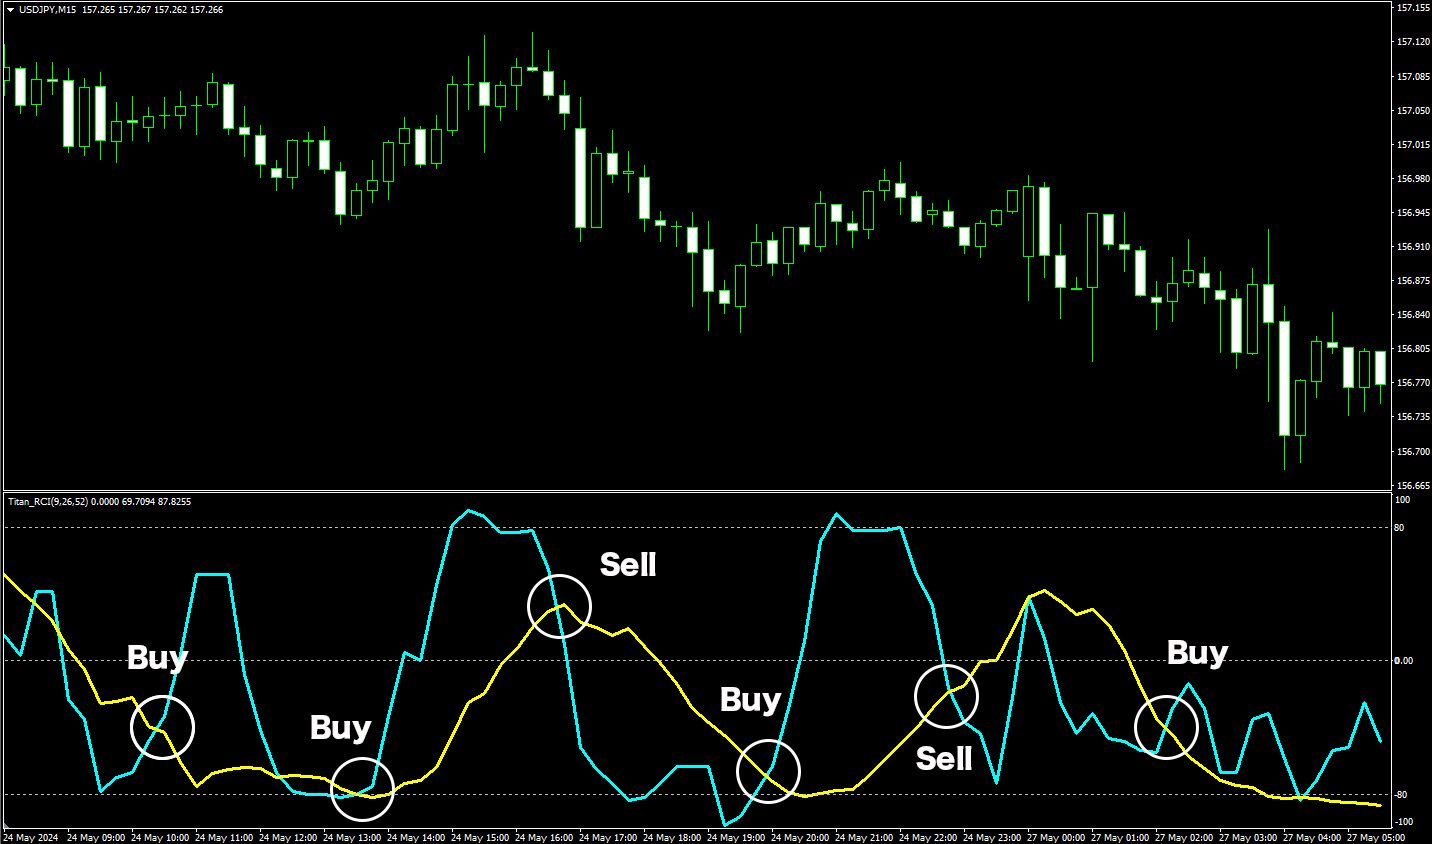
When analyzing with multiple RCI lines, pay attention to the crossover of RCIs from different periods. For instance, if the short-term RCI crosses below the long-term RCI at higher levels, it might indicate the peaking of an upward trend, prompting considerations for selling or closing long positions. Conversely, if the short-term RCI crosses above the long-term RCI at lower levels, it might suggest a bottoming out of a downward trend, prompting buying or closing short positions.
【Example of Analysis Using Multiple RCI Lines (Only Periods 26 and 52 Displayed)】
※ This indicator is only compatible with TitanFX's Windows version of MT5 and MT4.
Indicator Terms of Use
Only those who agree to all the following items may use the indicators distributed on this website (https://research.titanfx.com):
1.The indicators and related descriptions are based on various data believed to be reliable, but their accuracy and completeness are not guaranteed.
2.The data displayed by the indicators do not guarantee your investment results. Also, the displayed content may vary due to market conditions and communication environments.
3.Please make investment decisions using indicators at your own risk. We are not responsible for any disadvantages or damages arising from the use of indicators.
4.Specifications of the indicators are subject to change without notice. Changes will be announced on the indicator description pages, etc.
5.Indicators should only be used by customers who have downloaded them. Transferring or selling the indicators to third parties is prohibited.
Indicator Settings
Input (For MT5), Parameter Input (For MT4)
| Variable Name | Description | Default |
|---|---|---|
| Period 1-3 | Specifies the periods for the three RCI lines. | 9、26、52 |
Color Settings (For MT5), Color Configuration (For MT4)
| MT5 | MT4 | Description |
|---|---|---|
| 0 | 0 | Color, thickness, and style of the short-term RCI line |
| 1 | 1 | Color, thickness, and style of the medium-term RCI line |
| 2 | 2 | Color, thickness, and style of the long-term RCI line |