Indicator to Display States of Three Types of Trend Indicators (Titan_trend_checker)

Indicator Overview
Displaying the Status of Three Types of Trend Indicators in a Sub-Chart
This indicator displays the status of one of three selected trend indicators in a sub-chart. You can display the status of two moving averages (SMA, EMA), the status of the DMI, or the status of the Parabolic SAR. With its multi-timeframe feature, you can simultaneously view longer timeframe indicators while analyzing.
【Example showing the state of the SMA moving averages on an hourly chart and daily chart】
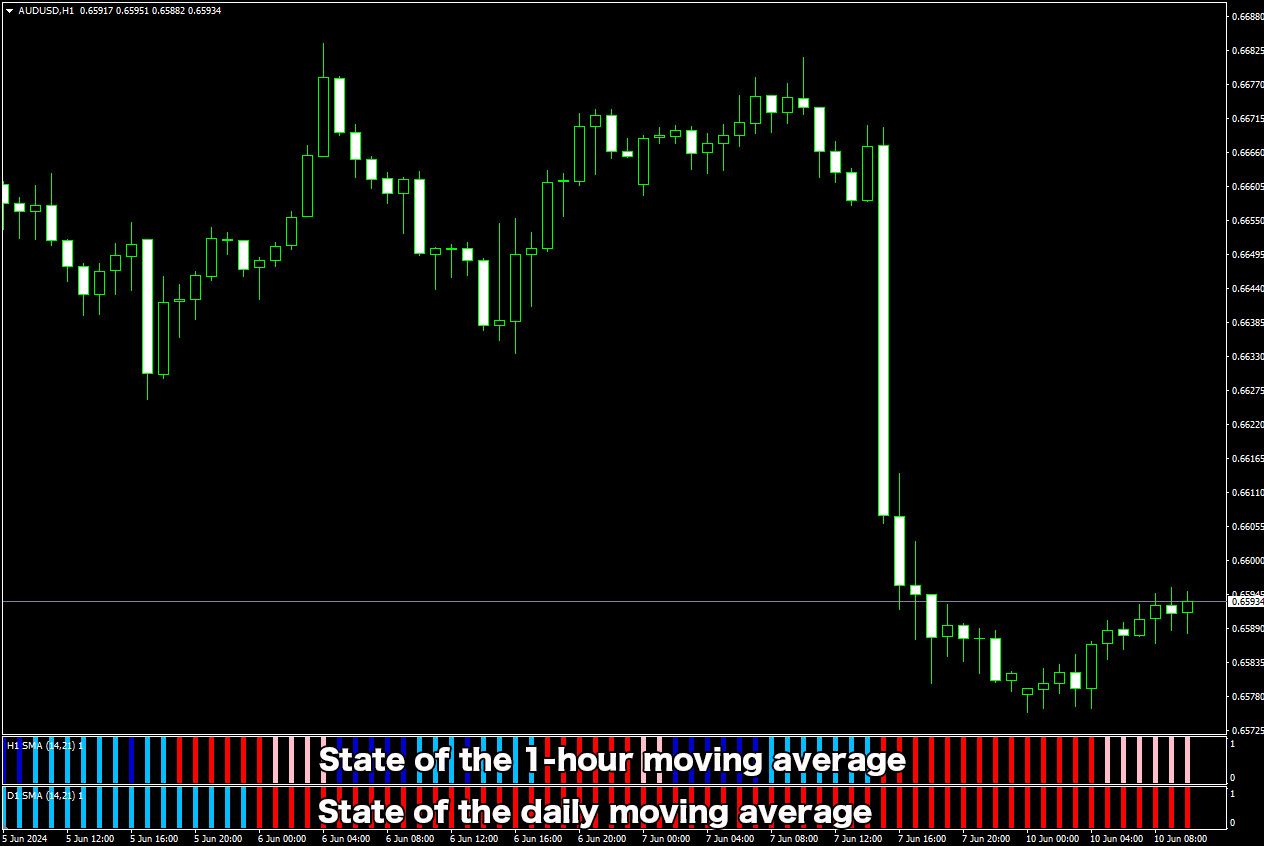
For Moving Averages (SMA, EMA)
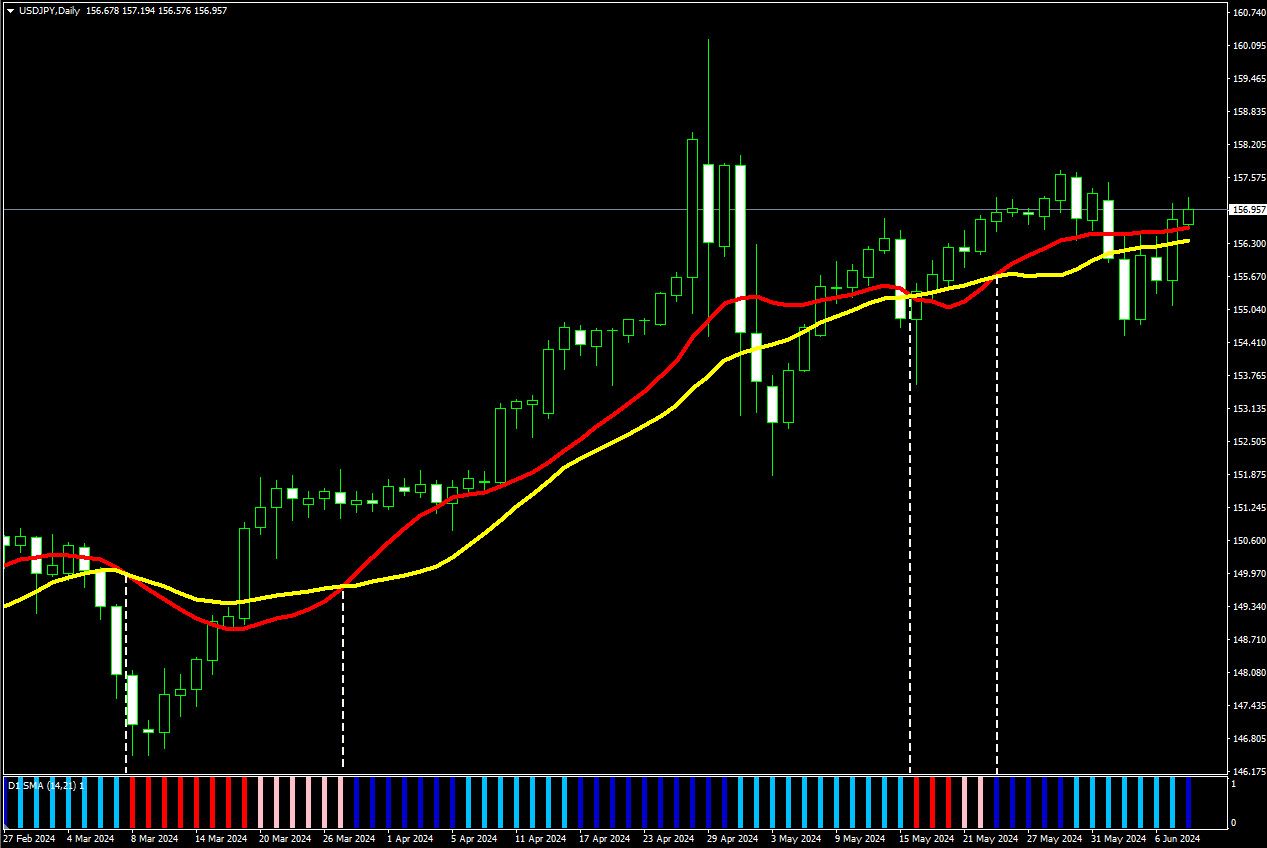
It displays the status of short-term and long-term moving averages. The relationship between the short-term and long-term moving averages and whether the distance between the two is increasing or decreasing from the previous bar is color-coded for easy checking.
Here’s how it is displayed:
| Relationship of Two Moving Averages | Change in Distance from Previous Bar | Default Color (Setting Number) |
|---|---|---|
| Short-term Above | Same or Increasing | Blue (0) |
| Short-term Above | Decreasing | Light Blue (1) |
| Short-term = Long-term | ー | Grey (2) |
| Short-term Below | Same or Decreasing | Pink (3) |
| Short-term Below | Increasing | Red (4) |
【Example showing moving averages' status (Note: moving averages are not displayed by this indicator itself.)】
For DMI
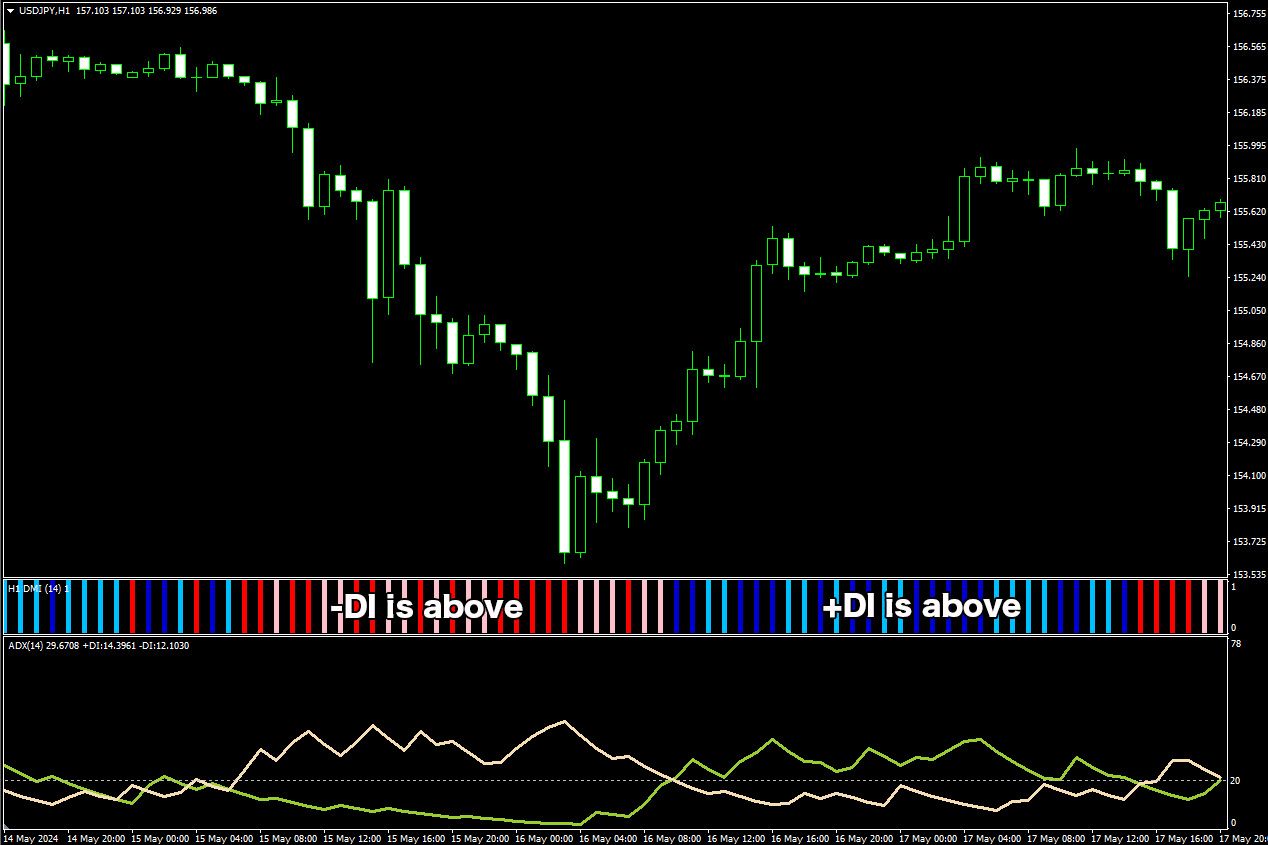
It allows you to check the relationship between +DI and -DI and the change in their difference from the previous bar.
It is displayed as follows, differentiated by color:
| Relationship of +DI and -DI | Change in Difference from Previous Bar | Default Color (Setting Number) |
|---|---|---|
| +DI Above | Same or Increasing | Blue (0) |
| +DI Above | Decreasing | Light Blue (1) |
| +DI=-DI | ー | Grey (2) |
| +DI Below | Same or Decreasing | Pink (3) |
| +DI Below | Increasing | Red (4) |
【Example showing DMI status (Note: DMI is not displayed by this indicator itself.)】
For Parabolic SAR
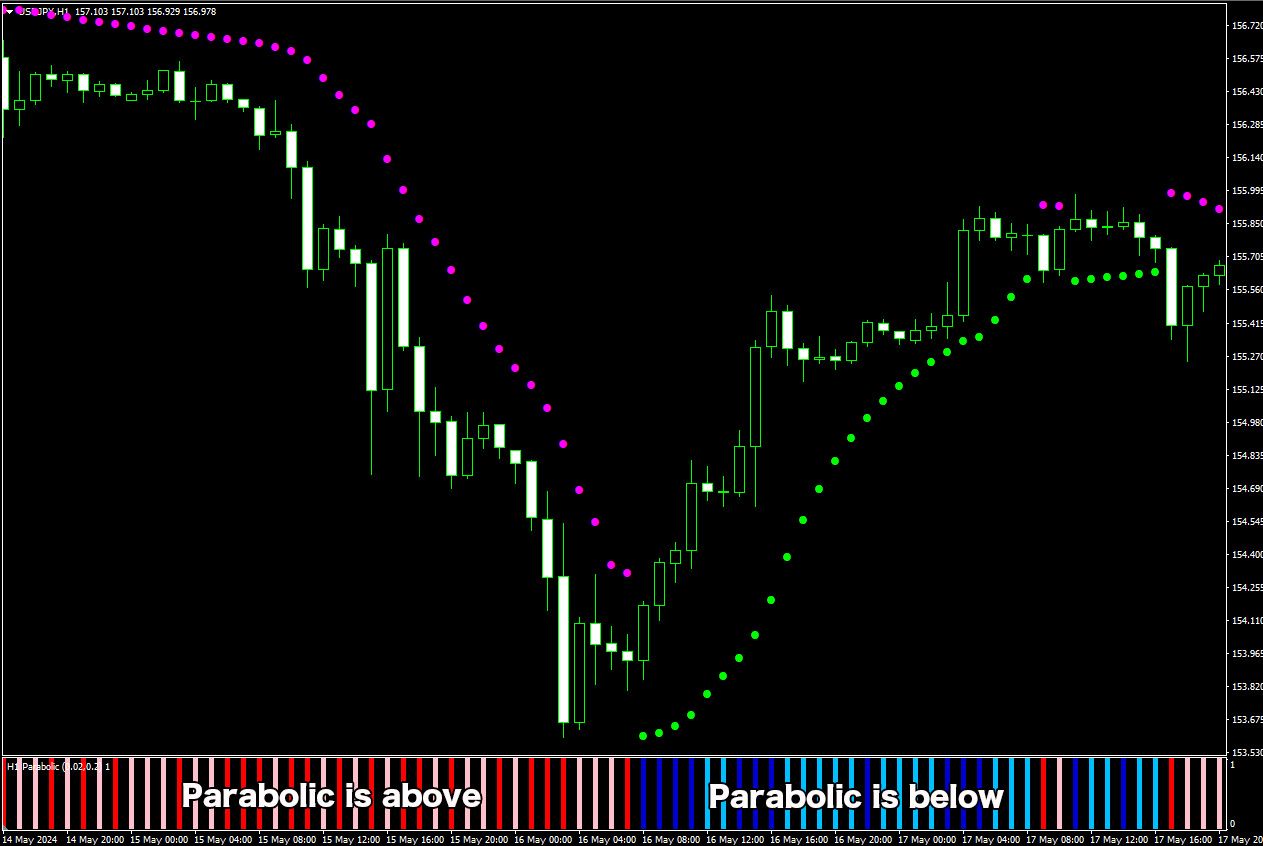
You can check the position of the Parabolic SAR relative to the price and the change in the gap from the previous bar.
It is displayed as follows, differentiated by color:
| Position of Parabolic SAR | Change in Distance from Previous Bar | Default Color (Setting Number) |
|---|---|---|
| Below Price | Same or Increasing | Blue (0) |
| Below Price | Decreasing | Light Blue (1) |
| Above Price | Increasing | Pink (3) |
| Above Price | Same or Decreasing | Red (4) |
【Example showing Parabolic SAR status (Note: Parabolic SAR is not displayed by this indicator itself.)】
※ This indicator is only operational on TitanFX's Windows version of MT5 and MT4.
Indicator Terms of Use
Only those who agree to all the following items may use the indicators distributed on this website (https://research.titanfx.com):
1.The indicators and related descriptions are based on various data believed to be reliable, but their accuracy and completeness are not guaranteed.
2.The data displayed by the indicators do not guarantee your investment results. Also, the displayed content may vary due to market conditions and communication environments.
3.Please make investment decisions using indicators at your own risk. We are not responsible for any disadvantages or damages arising from the use of indicators.
4.Specifications of the indicators are subject to change without notice. Changes will be announced on the indicator description pages, etc.
5.Indicators should only be used by customers who have downloaded them. Transferring or selling the indicators to third parties is prohibited.
Indicator Settings
Inputs (for MT5) and Parameter Inputs (for MT4) Tab Settings
| Variable Name | Description | Default |
|---|---|---|
| Time Frame | Specifies which time frame to display. Current shows the current chart's timeframe, others display data from a longer timeframe selected. | current |
| Type of indicator | Specifies which indicator data to display. Choose from SMA (Simple Moving Average), EMA (Exponential Moving Average), DMI, or Parabolic SAR. | SMA |
| Parameter 1 | Specifies the first parameter. For moving averages (SMA, EMA), it’s the period of the short-term moving average; for DMI, it's the period; for Parabolic, it’s the AF value (typically 0.02). | 14 |
| Parameter 2 | Specifies the second parameter. For moving averages (SMA, EMA), it’s the period of the long-term moving average; not used for DMI. For Parabolic, it’s the EP value (typically 0.2). | 21 |
Color (for MT5) and Color Settings (for MT4) Tab Settings
| MT5 | MT4 | Description |
|---|---|---|
| 0 | 0 | Specifies the color, line thickness, and type for state 0. |
| 1 | 1 | Specifies the color, line thickness, and type for state 1. |
| 2 | 2 | Specifies the color, line thickness, and type for state 2. |
| 3 | 3 | Specifies the color, line thickness, and type for state 3. |
| 4 | 4 | Specifies the color, line thickness, and type for state 4. |