Indicator for Checking Buying and Selling Momentum (Titan_VolatilityBalanceMeter)
Indicator Overview
A Simple Visualization of Whether Buyers or Sellers Are Dominant
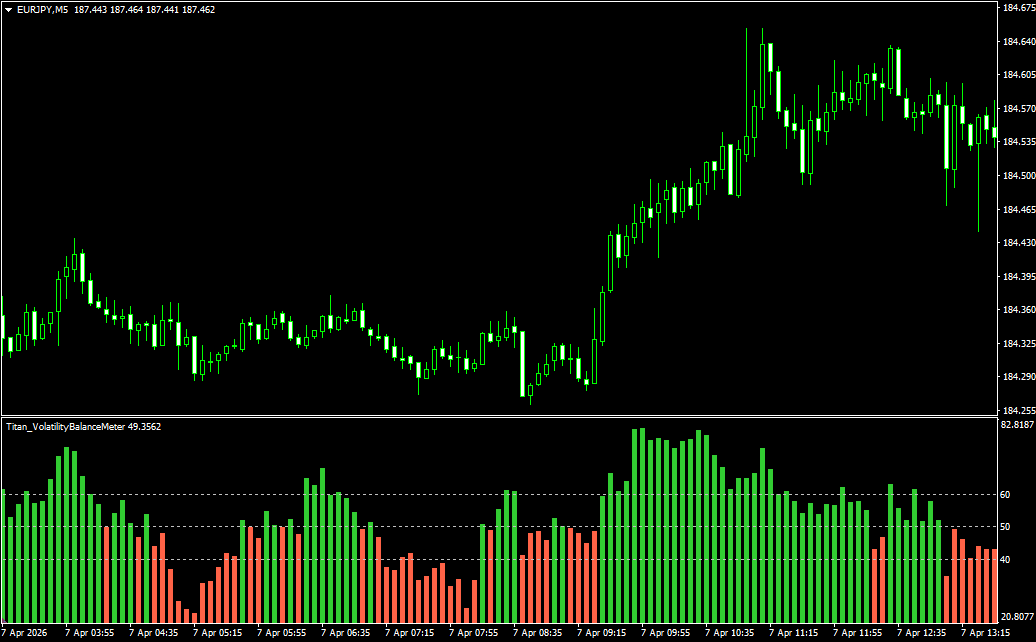
In the market, it is important not only to observe whether prices are rising or falling, but also to understand the balance of forces supporting those movements. The Volatility Balance Meter is an indicator that separates and aggregates upward and downward price movements, clearly showing which side currently has stronger momentum.
The display consists of values ranging from 0 to 100, with 50 as the central reference point for assessing market balance. When the value is above 50, buying pressure is dominant; when it is below 50, selling pressure is dominant. This allows even beginners to intuitively grasp whether they should focus on upward or downward movement.
A key feature of this indicator is that it does not require complex analysis. Unlike typical oscillators that determine overbought or oversold conditions, it simply indicates which direction is more likely to attract momentum. It is a suitable tool for those who want to confirm market direction without confusion or combine it with other signal-based indicators.
The Volatility Balance Meter is not designed to increase the number of trading decisions, but to organize them. It is recommended for those who want to reduce forced entries and calmly assess market trends.
This indicator works only on the Windows versions of MT5 and MT4 provided by TitanFX.
Indicator Terms of Use
Only those who agree to all the following items may use the indicators distributed on this website (https://research.titanfx.com):
1.The indicators and related descriptions are based on various data believed to be reliable, but their accuracy and completeness are not guaranteed.
2.The data displayed by the indicators do not guarantee your investment results. Also, the displayed content may vary due to market conditions and communication environments.
3.Please make investment decisions using indicators at your own risk. We are not responsible for any disadvantages or damages arising from the use of indicators.
4.Specifications of the indicators are subject to change without notice. Changes will be announced on the indicator description pages, etc.
5.Indicators should only be used by customers who have downloaded them. Transferring or selling the indicators to third parties is prohibited.
Indicator Settings
Input (for MT5) / Parameter Input (for MT4) Tab Settings
| Variable Name | Description | Default |
|---|---|---|
| Period | Specifies the number of bars used for calculation. | 14 |
| Bullish Threshold | Specifies the value of the horizontal line drawn above the center. | 60.0 |
| Bearish Threshold | Specifies the value of the horizontal line drawn below the center. | 40.0 |
| Lookback Bars | Specifies how many recent bars to measure. | 3000 |
Color (for MT5) / Color Settings (for MT4) Tab Settings
Not used in this indicator.
| MT5 Variable Name | MT4 Variable Name | Description |
|---|---|---|
| 0 | 0 | Specifies the color and line thickness of the graph when upward momentum is strong. |
| 1 | 1 | Specifies the color and line thickness of the graph when downward momentum is strong. |