What Are Stock Indices? Definitions, Types, Calculation & CFD Trading Guide
A stock index is a measure that tracks a basket of constituent stocks to reflect a whole market or sector — such as the S&P 500, NAS100, or US30 — and can be traded in a diversified, two-way manner via ETFs or CFDs.
From the S&P 500 to the NAS100, what exactly is the "index" you hear about daily in the news? Understanding how a stock index reflects the whole market — and how it becomes a tradable instrument — is the first step into index investing.
Beyond acting as an economic gauge, indices anchor a wide range of instruments such as ETFs, futures contracts, and CFDs (Contracts for Difference) — each suited to different risk profiles and trading horizons. This guide walks through the definition, calculation methods, major global indices, key price drivers, and how to trade stock indices via CFD on Titan FX.
- Definition: tracks a basket of constituents to reflect a market/sector
- Calculation & types: market-cap, price, or equal weighting
- Major indices: S&P 500, NAS100, US30, Nikkei, TAIEX, etc.
- Drivers: macro data, central banks, constituent earnings, sentiment
- How to trade: ETFs or index CFDs for two-way, leveraged trading
1. What Are Stock Indices?
A stock index is a quantitative tool that measures the performance of a stock market or a specific group of stocks. Its "constituents" — a representative basket of listed companies — track price or market-cap changes to reflect the dynamics of a market, industry, or broader economy.
Index movements are not only a barometer of market sentiment; they also underpin investment decisions and are widely used for portfolio management, risk hedging, and the design of derivative products such as ETFs, futures, and CFDs.
Main types of indices
Stock indices are typically grouped by scope and purpose:
-
Broad-market indices: Cover large-cap firms across multiple sectors, e.g. the S&P 500 (roughly 80% of US market cap) and CSI 300 (mainland China). Suited to investors seeking steady, diversified exposure.
-
Sector indices: Focused on a single industry, e.g. NAS100 (tech & innovation) and the Bloomberg Commodity Index. Useful for targeted exposure.
-
Regional indices: Represent the economy of a specific region, e.g. UK FTSE 100 and Germany DAX 40.
-
Thematic indices: Built around trends, e.g. MSCI ESG indices or small-cap Russell 2000 (US2000). Align portfolios with green or high-growth themes.
2. Calculation Methods & Classifications
The calculation method determines how sensitive an index is to its constituents, and directly influences both its interpretation and how traders approach it.
Overview of main methods
| Method | Core logic | Pros | Cons | Representative index |
|---|---|---|---|---|
| Price-weighted | Sum of constituent prices | Simple, intuitive | High-price stocks dominate | Dow Jones Industrial Average (DJIA) |
| Cap-weighted | Weighted by market cap (price × shares) | Reflects economic size | Concentrated in mega-caps | S&P 500, Nasdaq 100 |
| Equal-weighted | All constituents weighted equally | Reduces large-cap bias | Frequent rebalancing | S&P 500 Equal Weight |
| Fundamental-weighted | Weighted by financial fundamentals | Closer to intrinsic value | Sensitive to data quality | WisdomTree Fundamental series |
| Volatility-weighted | Weighted by historical volatility | Lower swings | May cap upside | MSCI Minimum Volatility Index |
Method 1: Price-weighted Index
A price-weighted index sums constituent prices and divides by a specific divisor, as in the Dow Jones Industrial Average. Higher-priced stocks drive more of the index, regardless of their market cap.
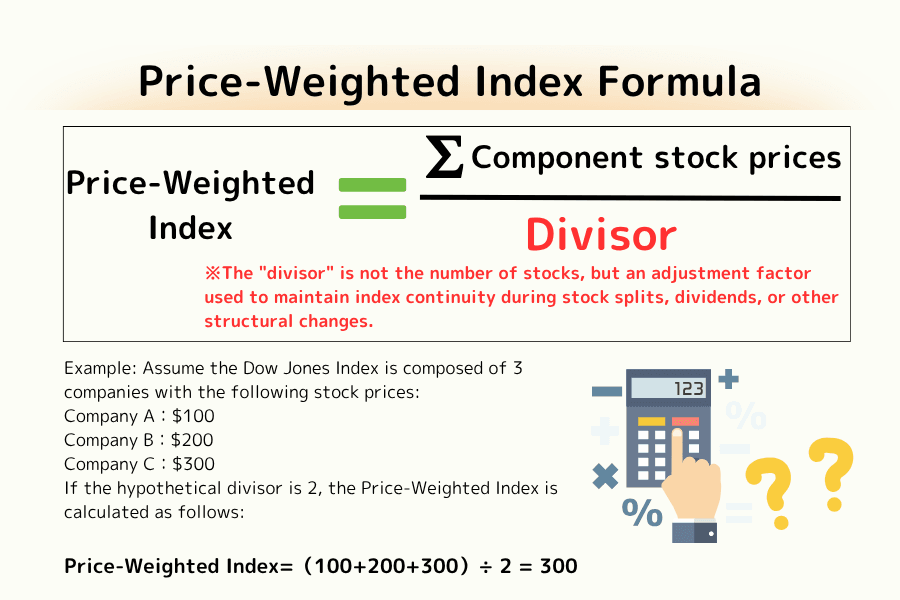
Example: Three companies — A $100, B $200, C $300 — with a divisor of 2: Price-weighted Index = (100 + 200 + 300) ÷ 2 = 300.
The "divisor" is not the number of shares; it's an adjustment factor that keeps the index value consistent through splits, dividends, and other structural changes.
Method 2: Capitalization-weighted Index
A cap-weighted index weights each company by market capitalization (price × shares outstanding), so larger firms have greater influence, as in the S&P 500.
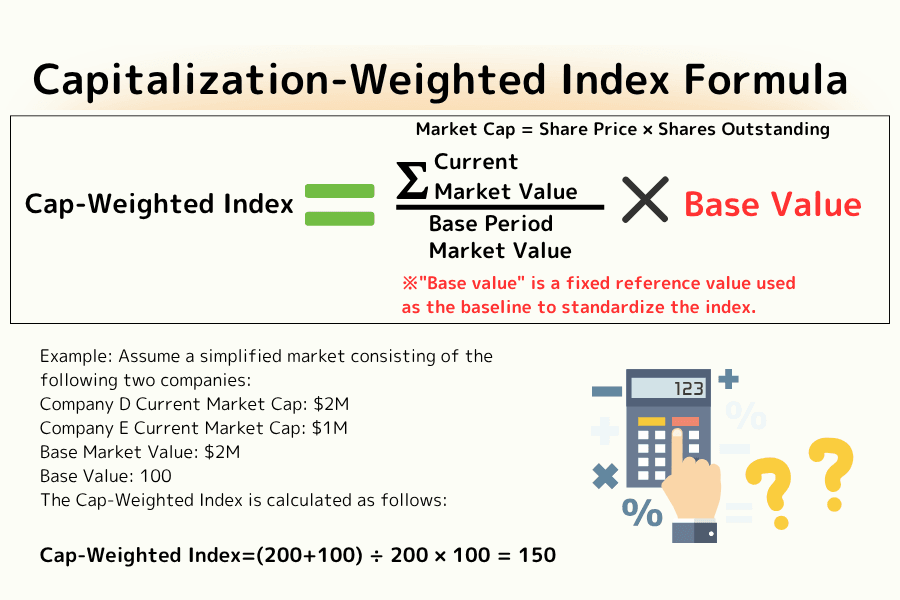
Example: D company market cap is $2m and E is $1m, base market cap total is $2m with a base value of 100 → Cap-weighted Index = (200 + 100) ÷ 200 × 100 = 150.
This method better reflects real-world economic weight, but swings in mega-caps can amplify index-level volatility.
Method 3: Equally Weighted Index
An equal-weighted index gives every constituent the same weight, eliminating over-concentration in a handful of mega-caps. The trade-off is more frequent rebalancing to maintain equal weights.
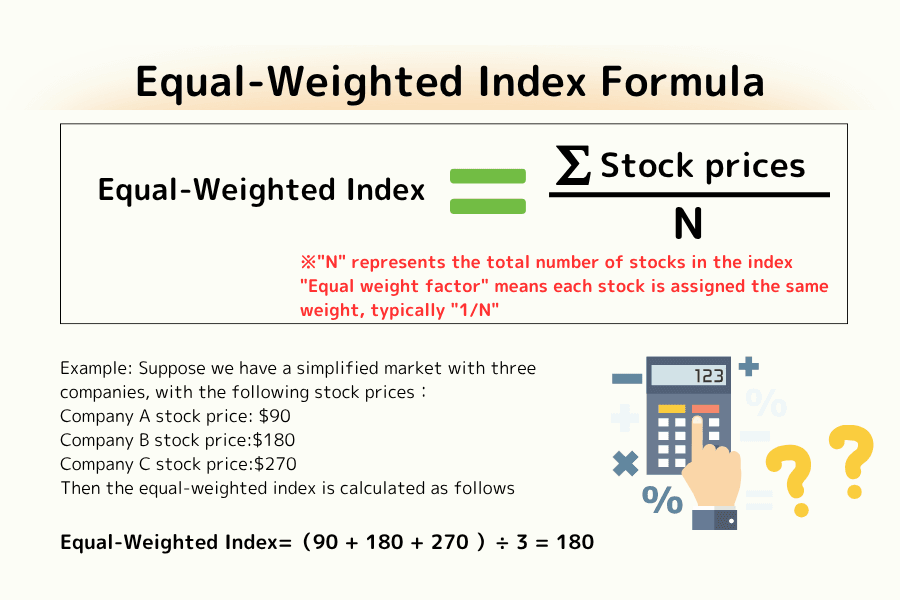
Example: A $90, B $180, C $270 → Equal-weighted Index = (90 + 180 + 270) ÷ 3 = 180.
Other derived methods
- Fundamental-weighted: Weights by revenue, net income, dividends, and cash flow (e.g. WisdomTree Fundamental series).
- Volatility-weighted: Downweights high-volatility names to enhance defensive characteristics (e.g. MSCI Minimum Volatility).
3. Major Global Stock Indices
Major indices around the world are essential references for observing global economic and capital flows.
| Region | Index (code) | Characteristics | Use case |
|---|---|---|---|
| North America | Dow Jones Industrial Average (US30) | 30 blue chips, price-weighted | Stable long-term allocation |
| North America | S&P 500 (US500) | 500 large caps, cap-weighted | Core allocation |
| North America | Nasdaq 100 (NAS100) | Non-financial tech-heavy, cap-weighted | Growth / tech exposure |
| North America | Russell 2000 (US2000) | Small-cap index | Domestic growth tilt |
| North America | S&P/TSX 60 (CAN60) | Canadian large caps (energy/financials heavy) | Resource-economy exposure |
| Europe | UK FTSE 100 (UK100) | UK blue chips, high dividend yield | Income portfolios |
| Europe | Germany DAX 40 (GER40) | German industrial/tech leaders | Germany proxy |
| Europe | France CAC 40 (CAC40) | French large multinationals | Eurozone core |
| Europe | Euro STOXX 50 (EUSTX50) | Eurozone blue chips | Pan-European allocation |
| Europe | Netherlands AEX 25 (NETH25) | Dutch large caps | European regional allocation |
| Asia | Nikkei 225 (JPN225) | 225 Japanese blue chips, price-weighted | Export & tech growth |
| Asia | TOPIX | Cap-weighted Japan broad index | Whole-market Japan proxy |
| Asia | FTSE China A50 (CN50) | Top 50 China A-share companies | Mainland growth exposure |
| Asia | Hang Seng Index (HK50) | HK financials & tech | HK/China-linked allocation |
| Asia | Hang Seng China Enterprises (HSCEI) | China H-shares listed in HK | Offshore China exposure |
| Oceania | Australia S&P/ASX 200 (AUS200) | Miners & financials dominant | Commodity-linked exposure |
| Global | US Dollar Index (USDX) | USD vs six major currencies | Global capital-flow gauge |
| Volatility | Volatility Index (VIX) | Market fear / risk aversion | Hedging tool |
4. Key Drivers of Index Prices
Stock indices move on multiple forces. Understanding them helps you forecast market direction and build sharper strategies.
1. Macroeconomics
-
Growth: GDP, employment data, and the ISM Manufacturing Index shape broad confidence. Strong Nonfarm Payrolls (NFP) typically lift US500 and NAS100.
-
Inflation & rates: Elevated inflation and central-bank hikes raise financing costs and compress growth-stock valuations. Low-rate regimes, by contrast, support growth names. NAS100 is especially sensitive to rate moves.
-
Consumer confidence: The Consumer Confidence Index (CCI) influences retail, e-commerce, and consumer-staples performance.
2. Industry & company factors
-
Industry trends: AI, cloud computing, and semiconductor cycles propel NAS100 tech names; energy price swings move UK100 energy stocks.
-
Earnings: Results and guidance from heavyweights like Apple, Microsoft, and NVIDIA directly drive NAS100 and US500.
-
Corporate events: M&A, buybacks, and regulatory actions can swing constituents and ripple into the index.
3. Geopolitics & sentiment
-
Geopolitics: Trade disputes, military conflicts, export controls, and tariff shifts affect multinationals. Rising geopolitical risk tends to weigh on indices via risk-off flows.
-
Sentiment: The Volatility Index (VIX) reflects hedging demand. A VIX above 25 signals heightened fear and typically wider swings.
-
Fund flows: Inflows into tech ETFs support NAS100; rotations out of growth into bonds or gold (XAUUSD) can pressure high-multiple sectors.
4. Monetary policy
Low rates and quantitative easing tend to push indices higher — particularly growth-tilted ones. In a hiking cycle, rising funding costs weigh on growth tech and can drag on NAS100.
Supporting tools
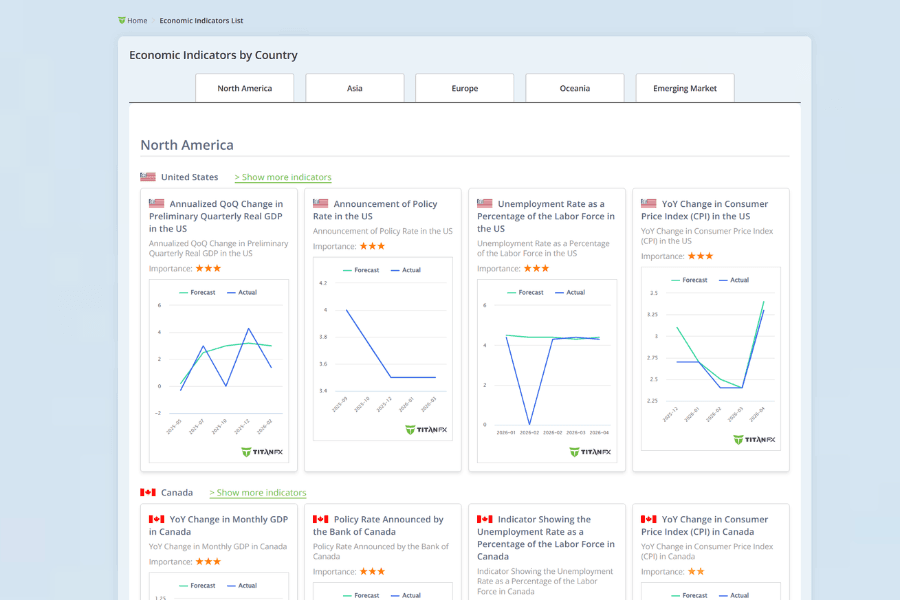
Track rate decisions, NFP, and CPI, and pair them with Titan FX tools:
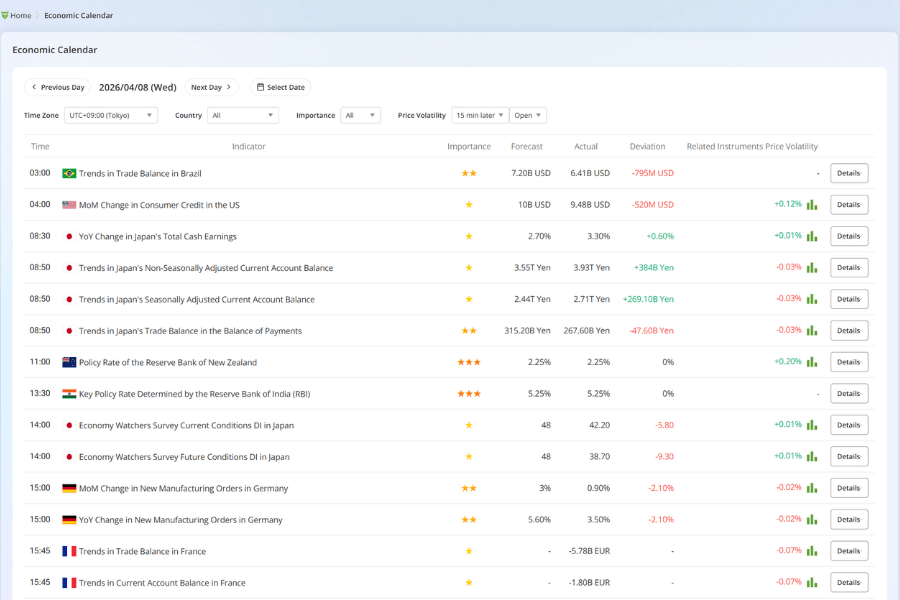
- Real-time economic calendar: follow major releases.
- Economic indicators by country: review PMI, GDP, and related data.
5. How to Trade Stock Indices via CFD
Stock indices can be traded through ETFs, futures, and CFDs — each fitting a different style and horizon.
Instrument comparison
| Instrument | Best for | Leverage | Term | Pros | Risks |
|---|---|---|---|---|---|
| ETF | Long-term investors | None / 1x | No expiry | Diversified, stable | Limited return amplitude |
| Futures | Professionals | High (10–20x) | Contract expiry | Low cost, strong liquidity | Strict margin risk |
| CFD | Short-to-mid-term traders | Flexible (1–500x) | No expiry | Two-way trading, capital efficient | Margin-call risk |
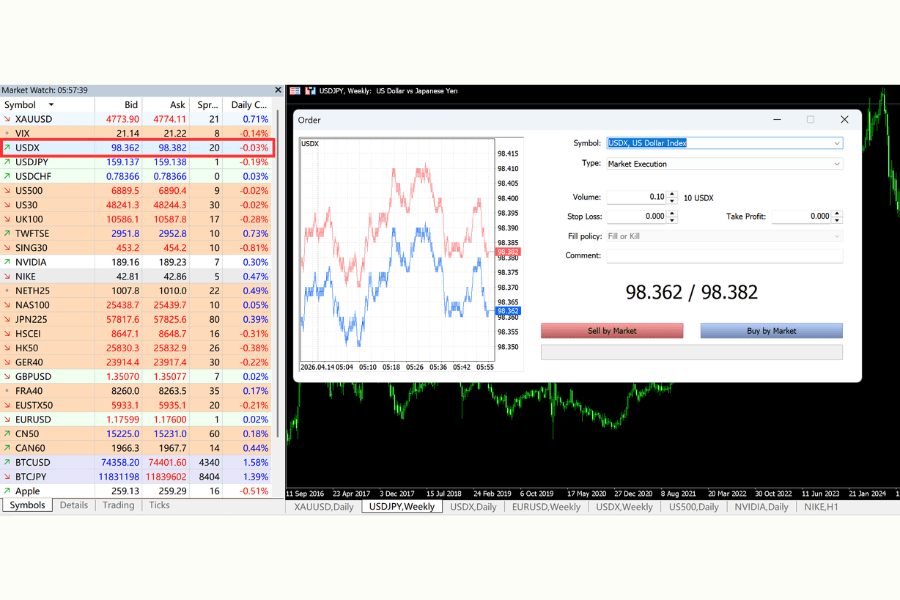
Titan FX offers index CFD trading with up to 500x leverage, long/short flexibility, and browser-based trading via WebTrader. The example below uses USDX.
USDX CFD trading hours
| Region / time zone | Winter (GMT+2) | Summer (GMT+3) |
|---|---|---|
| MT4/MT5 server time | 03:00–23:59 (open Mon 01:00 / close Fri 23:55) | 03:00–23:59 (open Mon 01:00 / close Fri 23:55) |
| Taiwan / HK / Beijing (GMT+8) | 09:00–05:59 (next day) | 08:00–04:59 (next day) |
| Japan (GMT+9) | 10:00–06:59 (next day) | 09:00–05:59 (next day) |
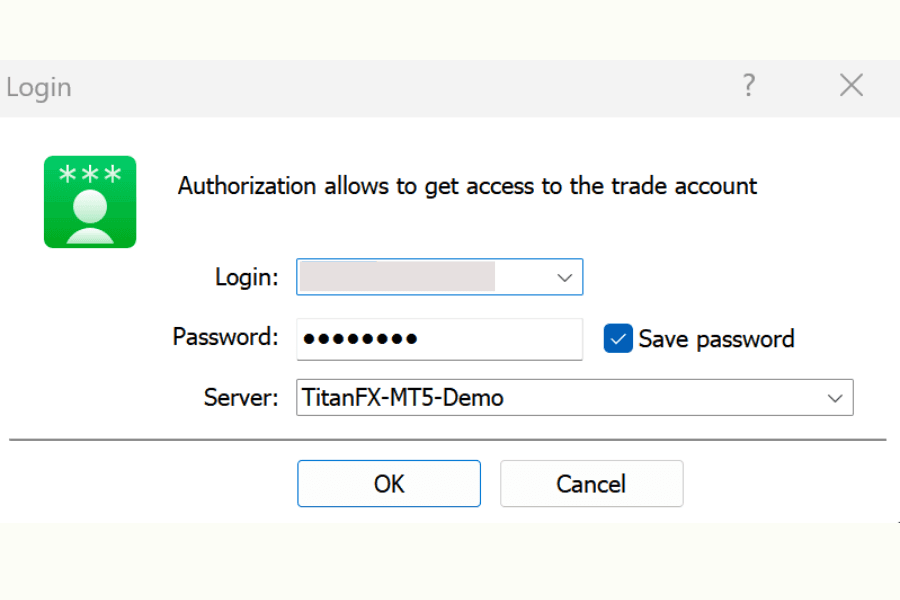
Step 1: Log in to your trading account
Download MT4 or MT5 and log in with your credentials.
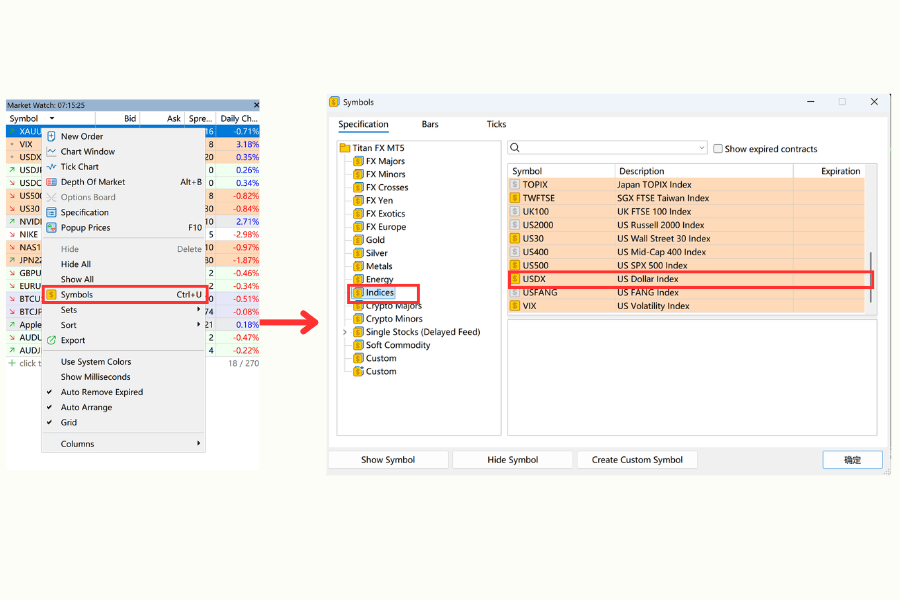
Step 2: Add the index quote
Right-click the Market Watch window, choose Symbols, expand the Indices category, and double-click your chosen index (e.g. USDX) to add it.
Step 3: Place the trade
Double-click the quote or open its chart, specify lot size and direction, set stop-loss and take-profit, and execute.
Titan FX provides a free demo account so you can learn index-CFD trading risk-free.
Titan FX research tools
Titan FX provides a suite of analytical tools for index traders:
- Support & resistance: identify key levels.
- Order book: see long/short positioning.
- Trend analysis: gauge current trend direction.
- RSI analysis: spot overbought/oversold conditions.
- Volatility heatmap: map volatility across sessions.
- Percentage change ranking: compare real-time moves.
- Swap calendar: review overnight financing.
- Dividend calendar: track ex-dividend impacts.
- Margin calculator: size positions accurately.
For the latest spreads, see the official page.
For live prices and trading conditions, see the US30, US500, and NAS100 product pages.
Start trading global stock indices Trade stock-index CFDs on Titan FX with up to 500x leverage, tight spreads, and long/short flexibility. Zero Standard and Zero Blade accounts support index CFDs (Zero Micro does not).
6. FAQ
Q1. How do stock indices differ from investing in individual stocks?
Stock indices are a diversified instrument: a basket of constituents reflects the broader market and cushions against company-specific risk, making them suitable for steady, long-horizon allocations. Single-stock investing concentrates exposure in one company and carries higher upside alongside idiosyncratic fundamental, earnings, and regulatory risks. For example, owning NAS100 gives you aggregate exposure to Apple, Microsoft, and NVIDIA together; owning NVIDIA alone means you bear its entire company-specific performance.
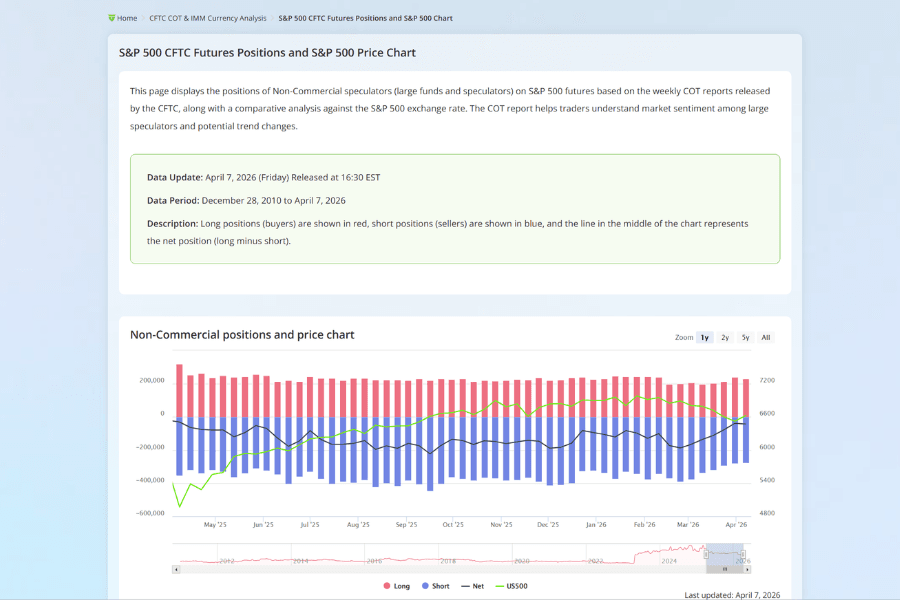
Q2. How can CFTC positioning help forecast index trends?
The weekly CFTC Commitments of Traders (COT) report tracks futures positioning by institutions and speculators. By watching changes in net-long vs net-short positions you can gauge capital flow and sentiment. For NAS100 and US500, a growing non-commercial net-long typically signals bullish conditioning, while a rising net-short can flag short-term pullback risk. COT shifts tend to have a reference value over the following one to four weeks. See the latest data on the Titan FX CFTC page.
Q3. Which technical and fundamental strategies work for stock indices?
On the technical side, use 20- and 50-day moving averages to capture the main trend, RSI to identify overbought (>70) and oversold (<30) conditions, MACD and Bollinger Bands for turning points and breakouts, and the VIX to monitor sentiment risk. On the fundamental side, track industry trends in AI, EVs, cloud, and semiconductors; monitor quarterly earnings from heavyweight constituents (Apple, Microsoft, NVIDIA); and follow NFP, GDP, CPI, and Fed rate decisions. Combining both lenses improves win rate and risk control.
Q4. Which economic indicators correlate most with stock indices?
NAS100 is closely linked to the ISM Services PMI (>50 signals expansion), the Consumer Confidence Index (CCI), and AI/tech trends. US500 is highly sensitive to Nonfarm Payrolls (NFP), CPI, and Fed rate policy — reflecting the overall health of the US economy. Use the Titan FX economic calendar to stay current and fine-tune short- to mid-term strategies.
Q5. What is the maximum leverage for index CFDs on Titan FX?
Titan FX offers up to 500x leverage for index CFDs on Zero Standard and Zero Blade accounts (Zero Micro does not support index CFDs). High leverage must be paired with disciplined stop-loss and money management — a common guideline is to keep per-trade risk within 1–2% of account equity.
7. Summary
Stock indices are no longer mere statistical aggregates — they sit at the core of modern portfolios. Whether you want stable exposure to large-cap America through the US500 or a ride on AI and tech innovation via NAS100, indices can match a range of objectives.
Through ETFs, futures, and CFDs, investors can align instruments with their risk tolerance and capital. CFDs stand out for short- to mid-term index trading thanks to high leverage, two-way trading, no expiry, and flexible capital management.
Use the Titan FX economic calendar, CFTC positioning data, and the VIX Volatility Index to combine fundamental and technical analysis, and participate in global stock-index markets with confidence.
Further Reading
Titan FX Trading Strategy Lab. We produce investor-education content covering forex, commodities (crude oil, precious metals, agricultural goods), stock indices, U.S. equities, and digital assets.
Primary Sources (by Category)
- Index providers: General methodologies of S&P Dow Jones Indices, Nasdaq, FTSE Russell
- Titan FX official: About US30, What is an ETF?