How to Draw Trendlines on MT4 (Mac)
In MT4, you can draw trendlines anywhere on the chart. This guide explains the basic methods for drawing, modifying, and customizing trendlines.
How to Draw a Trendline
To draw a trendline, first switch to trendline drawing mode. This can be done in one of the following ways:
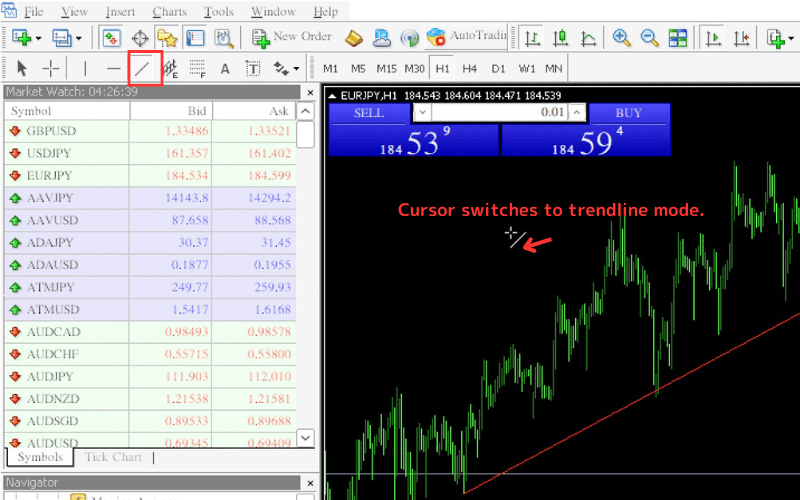
Method 1: Use the Toolbar
Click the trendline icon in the toolbar. After clicking, move the cursor over the chart, and the cursor will switch to trendline drawing mode.
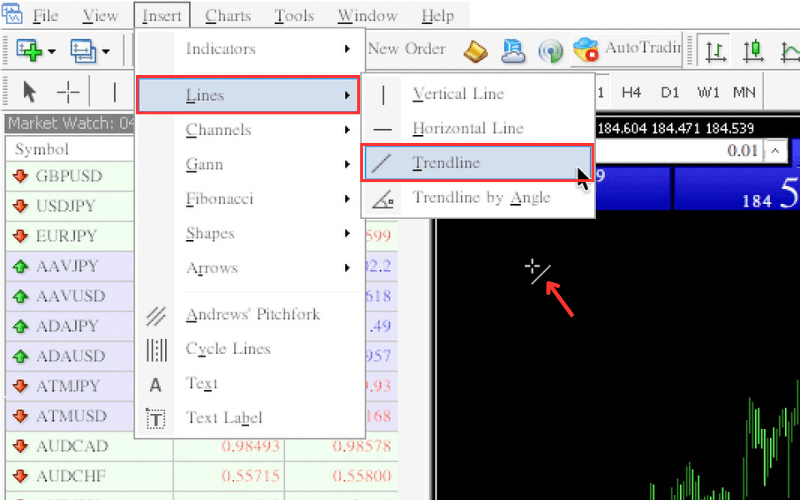
Method 2: Use the Menu
Select "Trendline" from "Lines" under the "Insert" menu. Then move the cursor over the chart, and the cursor will switch to trendline drawing mode.
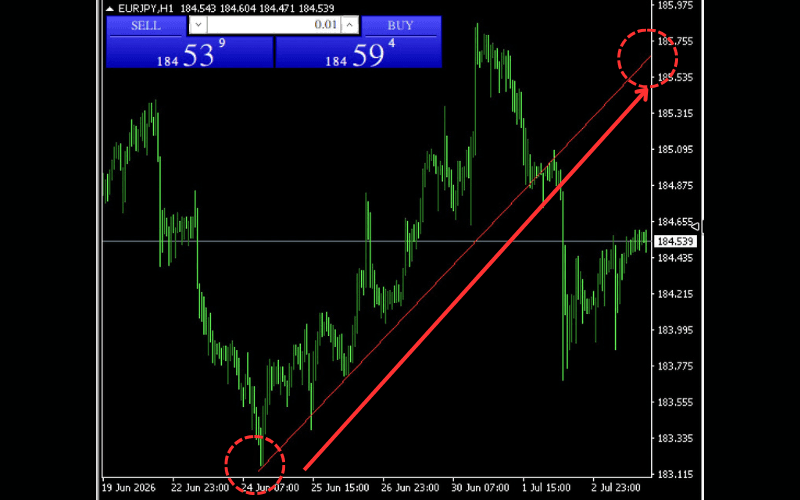
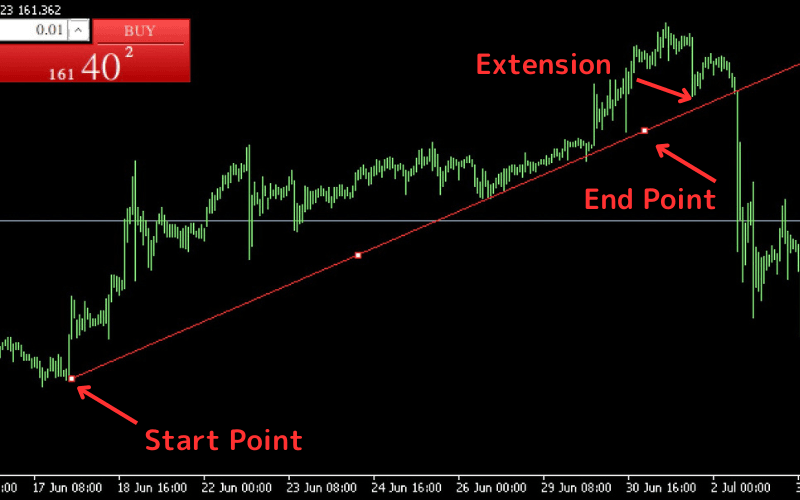
How to Draw a Line
In trendline drawing mode, drag from the starting point to the endpoint, then release the mouse to complete the trendline.
How to Modify a Line's Position on the Chart
To modify a line's position on the chart, first select the line. Here's how to toggle selection and deselection, and how to move the line:
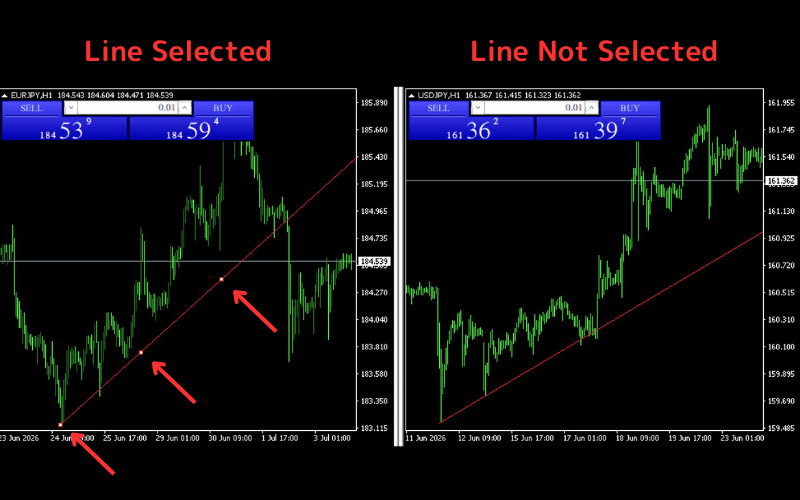
Check if a Line is Selected or Deselected
You can tell if a line is selected by the display on the line. When selected, small squares appear at the start, end, and midpoint of the line.
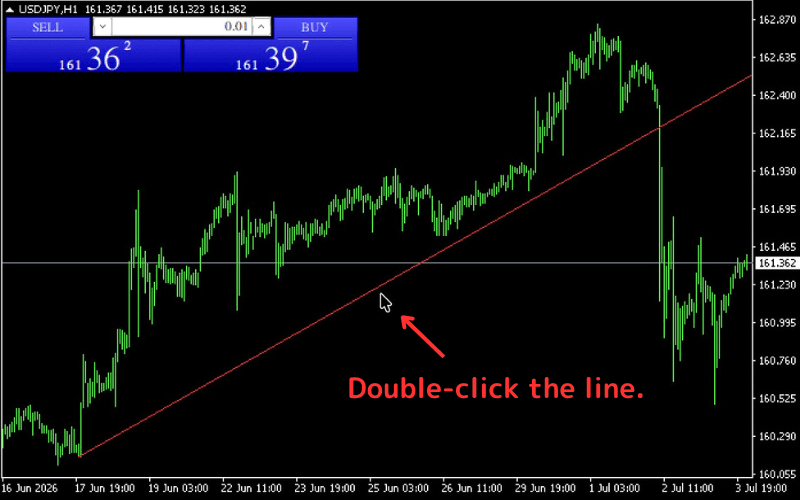
Toggle Line Selection
Hover the cursor over the line and double-click to toggle between selected and deselected.
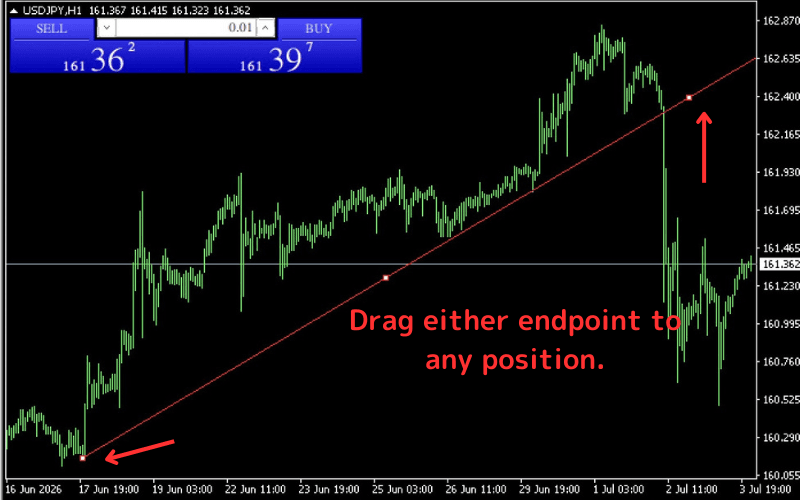
Modify the Start and End Points
Hover the cursor over the start or end point of the line, then drag to move the points freely.
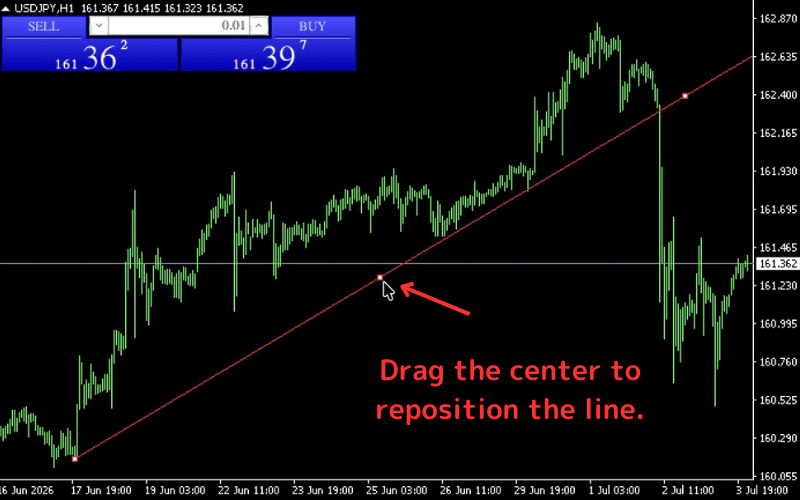
Move the Line Position
To move the line while keeping its shape, hover the cursor over the center square, then drag to reposition the line.
Modifying a Line via the Properties Window
Detailed modifications can be made via the line's properties window. You can access this window in one of the following ways:
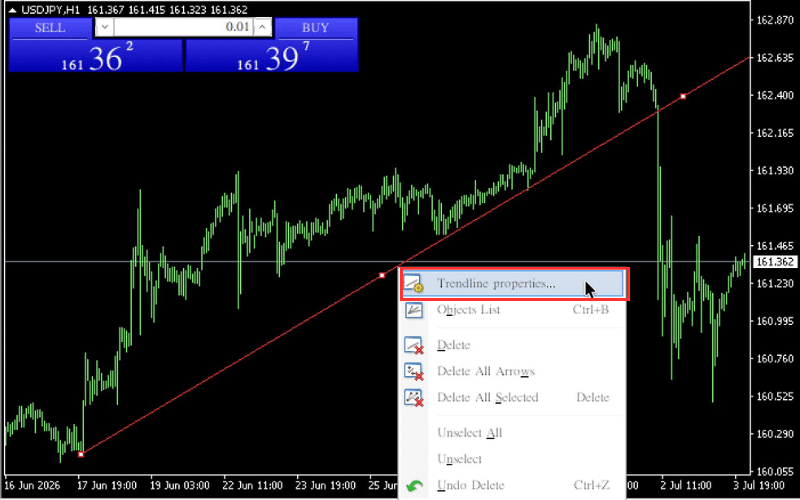
Method 1: Right-Click on the Line
When the trendline is selected, right-click on the line and choose "Trendline properties" from the menu to open the properties window.
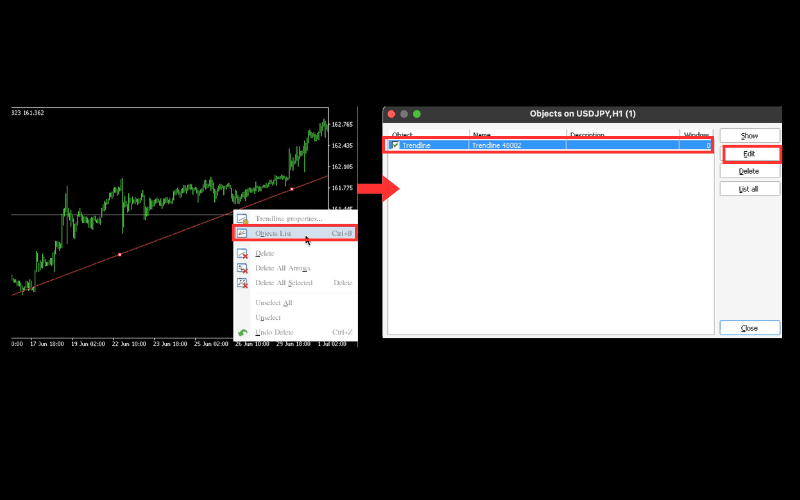
Method 2: Use the Objects List
Right-click on the chart and select "Objects List" from the menu (shortcut: Ctrl+B). Click on the line you want to modify from the list and select "Edit" on the right to open the properties window.
The properties window consists of three tabs: "Common", "Parameters", and "Visualization". Here are the items you can set on each tab.
- The settings under the "Common" tab and the "Ray" setting under the "Parameters" tab are saved and will be applied the next time you draw a line.
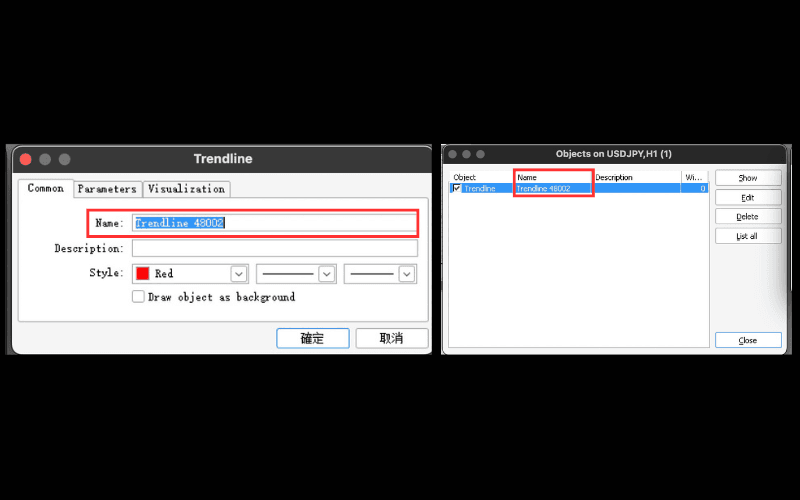
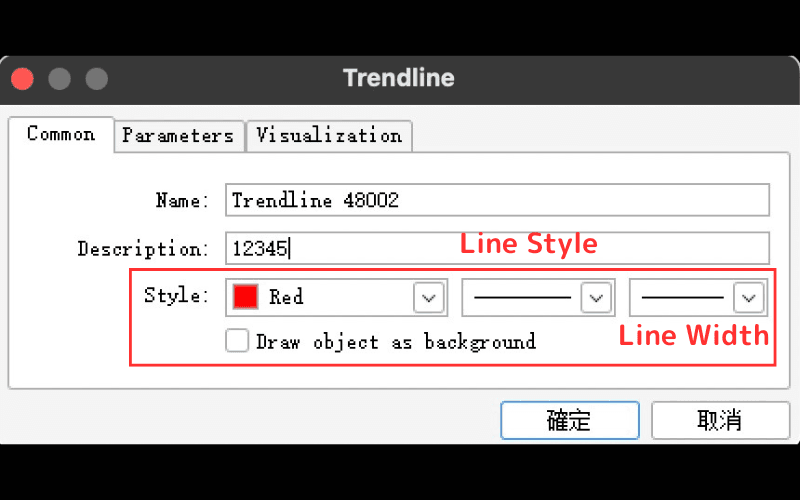
Modifications in the "Common" Tab
The "Common" tab allows you to set the line's name, description, and style.
Line Name
You can change the line's name under "Name" in the "Common" tab. The line's name will appear in the objects list, etc.
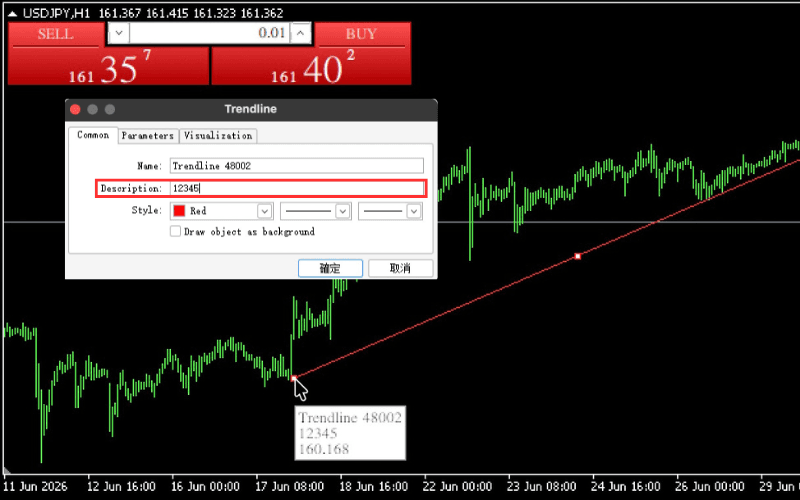
Line Description
You can add a description in the "Description" field. If "Show object descriptions" is checked in the chart properties, the description will appear near the line.
Line Style
You can specify the line's color, type, and thickness under "Style". Note that if the line is thickened, only a solid line can be selected due to system limitations.
If "Draw object as background" is checked, the line will be displayed behind candlesticks. Unchecking it will display the line in front of candlesticks.
Modifications in the "Parameters" Tab
The "Parameters" tab allows you to specify the start and end points by time and price, as well as set extensions for the line.
Specify Start and End Points
The start point can be specified by entering the "Time" and "Value" in the upper section of the "Parameters" tab, and the end point can be specified in the lower section. Use this method for precise placement of the trendline.
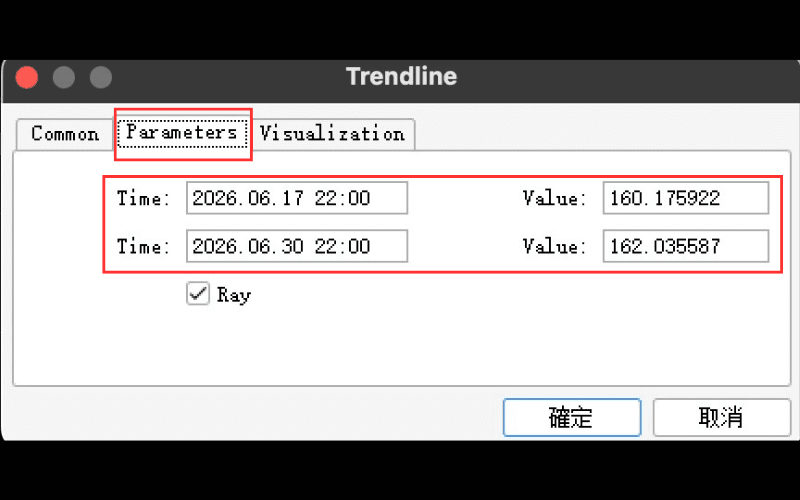
Set Line Extensions
Check the "Ray" checkbox in the "Parameters" tab to extend the line beyond its endpoint.
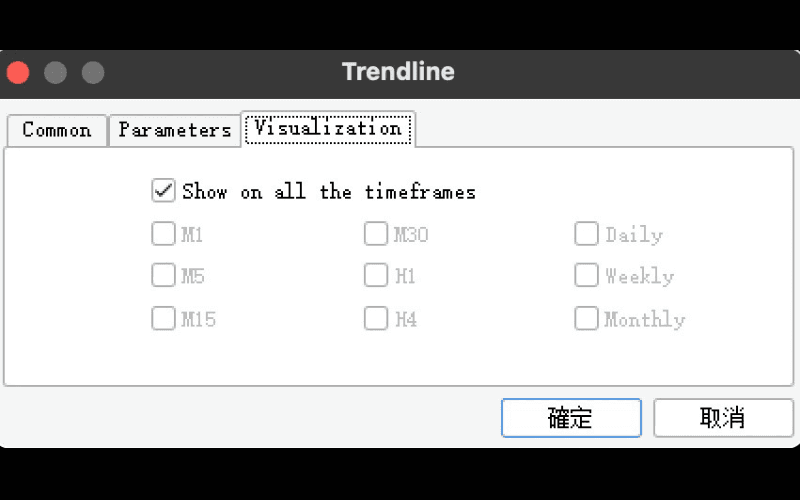
Modifications in the "Visualization" Tab
The "Visualization" tab allows you to specify which timeframes the line is displayed on.
Select Timeframes for Display
If "Show on all the timeframes" is checked, the line will be displayed on all timeframes. Unchecking this allows you to toggle the display for each timeframe individually. (The line will only be displayed on the timeframes that are checked.)