How to Set Up Indicators on MT5 (Mac)
In MT5, you can add technical indicators such as moving averages, MACD, and RSI to your charts. This guide explains how to display, configure, and manage indicators on MT5 (Mac).
How to Display Indicators
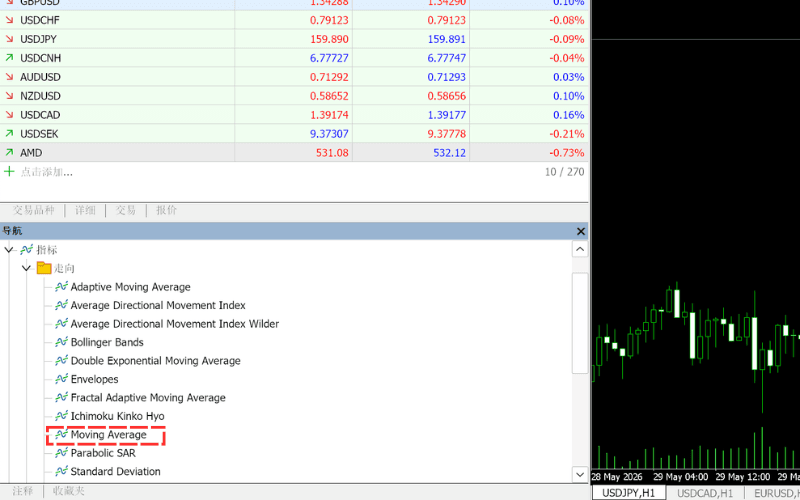
Select the chart, then double-click the desired indicator name in the "Indicators" section of the Navigator, or drag and drop the indicator name onto the chart.
Adjusting Indicator Parameters
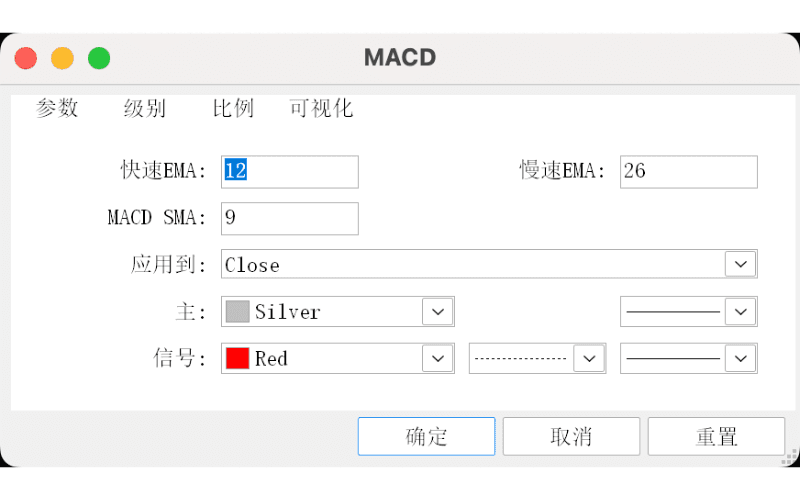
When you add an indicator, a settings window appears where you can configure its parameters. The window contains the Parameters, Levels, Scale, and Visualization tabs (the tabs shown vary depending on the indicator). Click "OK" to apply your settings, or "Reset" to restore the default values.
Parameters Tab
Use the Parameters tab to set the indicator's calculation parameters (the image shows the Fast EMA, Slow EMA, and MACD SMA settings of MACD, along with "Apply to"). The color, line style, and line width of the indicator are also set on this tab.
Levels Tab
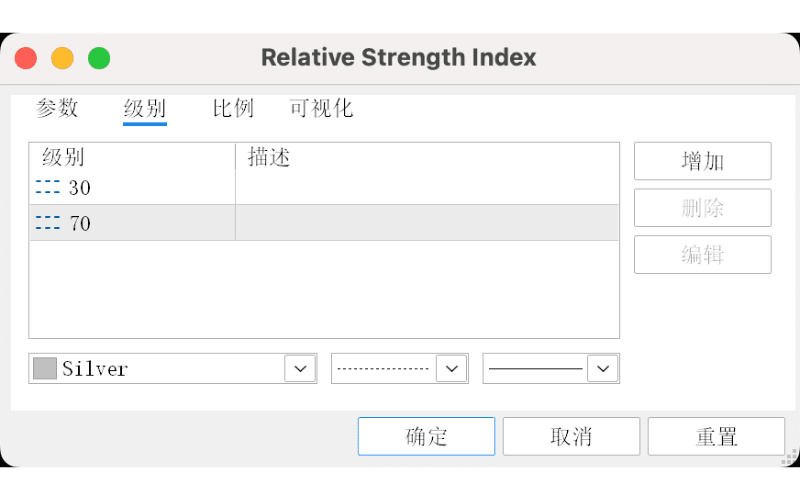
The Levels tab is used to draw horizontal lines for indicators displayed in sub-charts (the image shows the 30/70 levels of RSI). Click the "Add" button to add a level and specify its value. Select an existing level to "Delete" or "Edit" it, and set the level's color, line style, and width at the bottom.
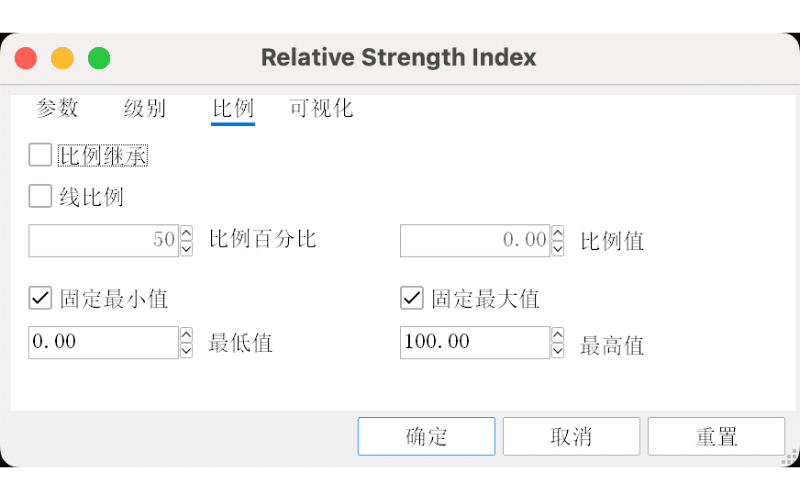
Scale Tab
The Scale tab is used to set the scale range for indicators drawn in sub-charts. Check "Fixed minimum" and "Fixed maximum" and enter the values to fix the indicator's display range. Options such as scale inheritance and per-line scaling are also available.
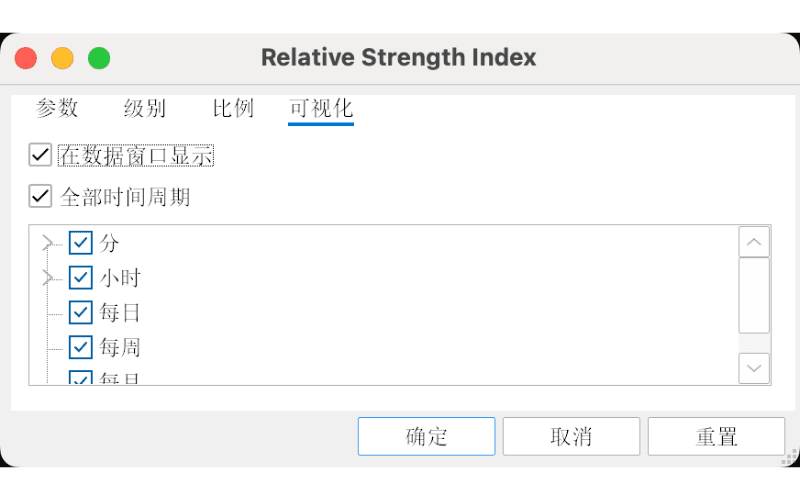
Visualization Tab
The Visualization tab is used to specify the timeframes on which the indicator is displayed. Check "All timeframes" to show the indicator on every timeframe, or uncheck it and select the timeframes individually from the list. Check "Show in the Data Window" to display the indicator's values in the Data Window.
Managing Displayed Indicators
Modifying Parameters from the Indicators List
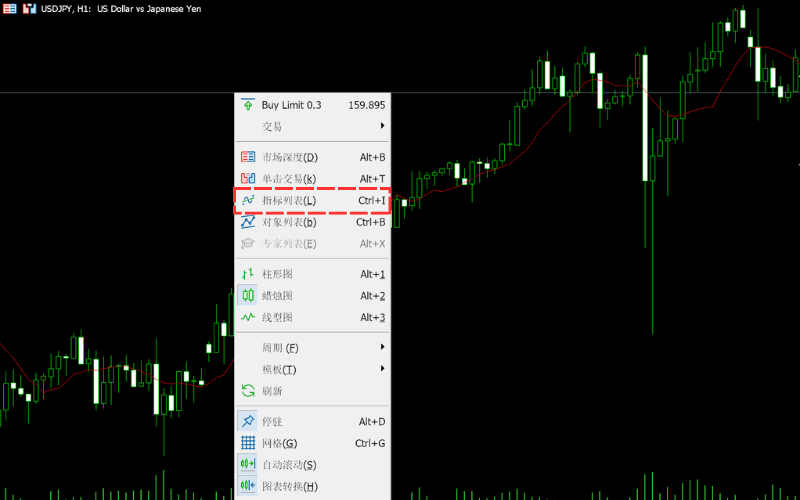
Right-click on the chart, then select "Indicators List" (shortcut: Ctrl+I) from the menu.
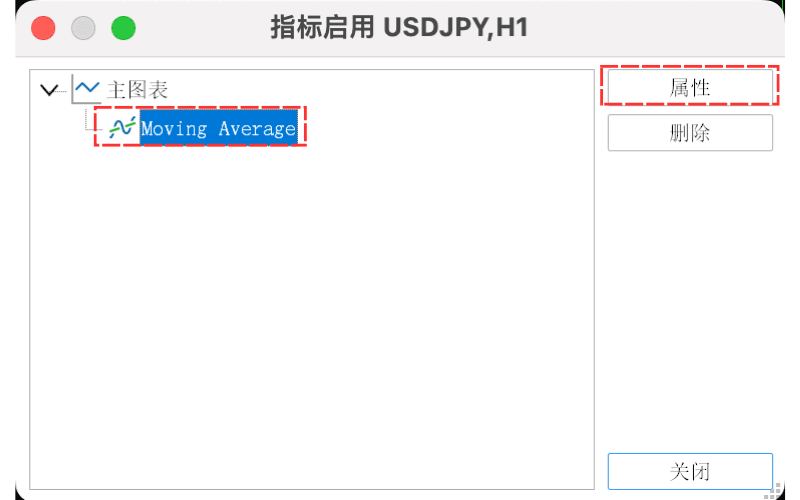
In the indicator list window that opens, select the indicator you want to modify, click the "Properties" button, make your changes in the settings window, then click "OK" to apply them.
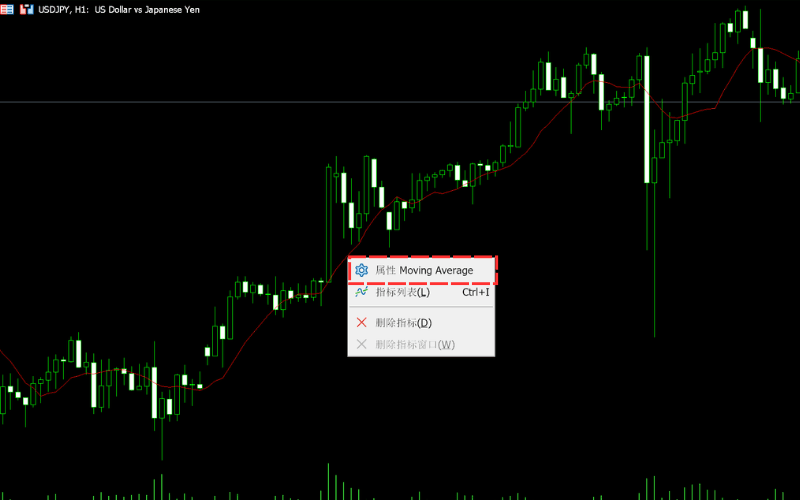
Opening the Settings Window from the Chart
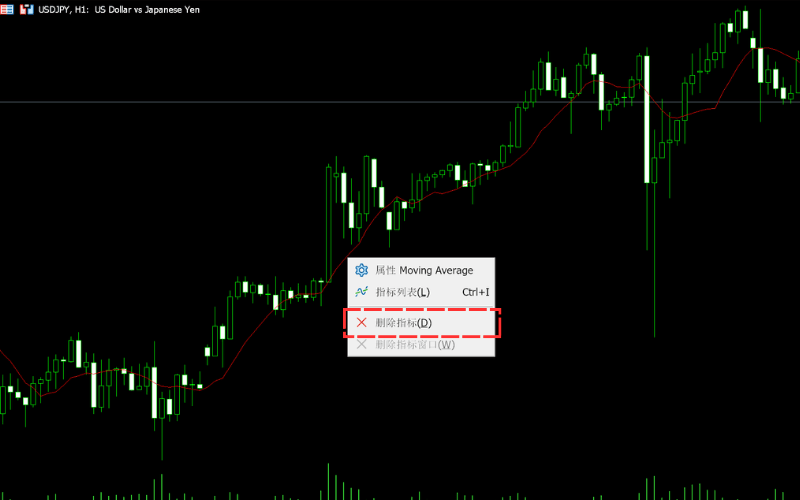
Right-click on the indicator on the chart and select "Properties" at the top of the menu (shown as "Properties" followed by the indicator name, e.g. "Properties Moving Average") to open the settings window, where you can adjust the parameters.
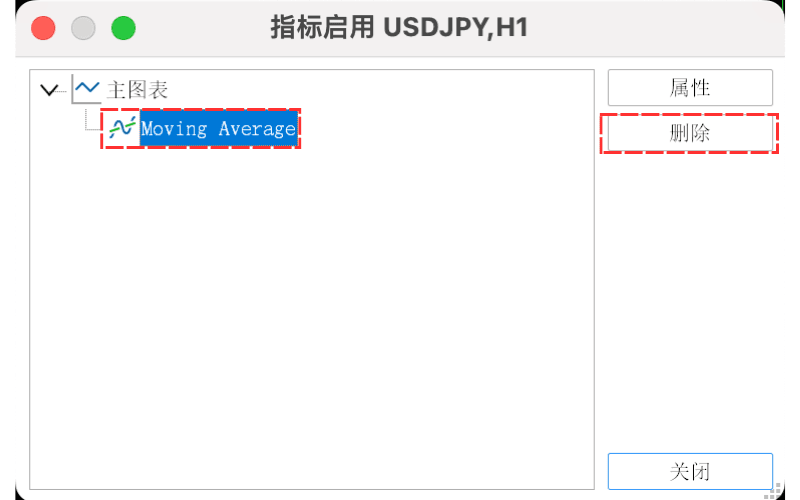
Deleting from the Indicators List
Right-click on the chart, then select "Indicators List" from the menu.

In the indicator list window, select the indicator you want to delete and click the "Delete" button to remove it.
Deleting from the Chart
Right-click on the indicator on the chart and select "Delete Indicator" from the menu to remove it.