How to Display Mini Charts in MT5 (Mac)
In MT5, you can display small charts (mini charts) on your main chart. Mini charts let you change the symbol and timeframe and display multiple instances, offering a high degree of customization.
How to Display a Mini Chart
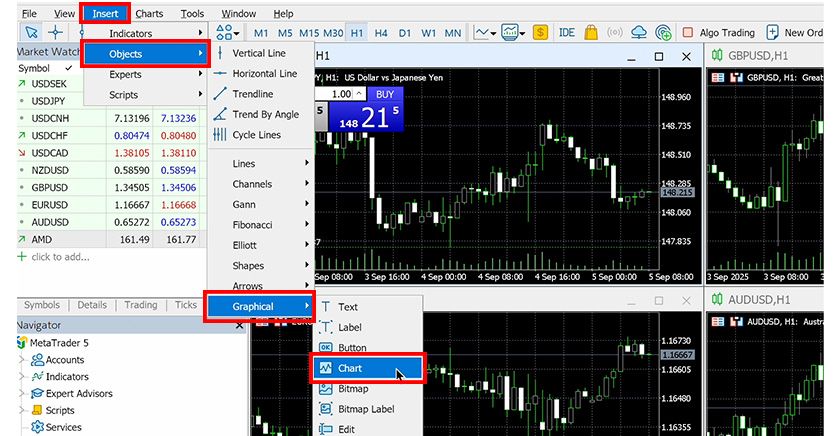
Select the chart where you want to display a mini chart, then open the "Insert" menu and choose "Objects" → "Graphical" → "Chart".
Click the desired position on the chart to display the mini chart.
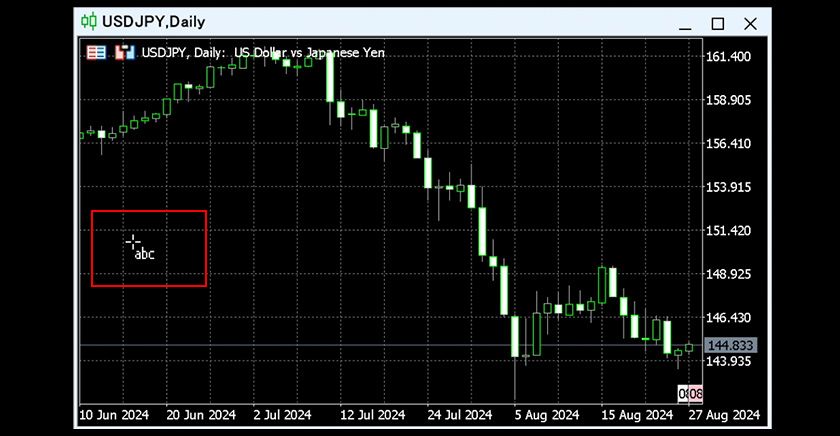
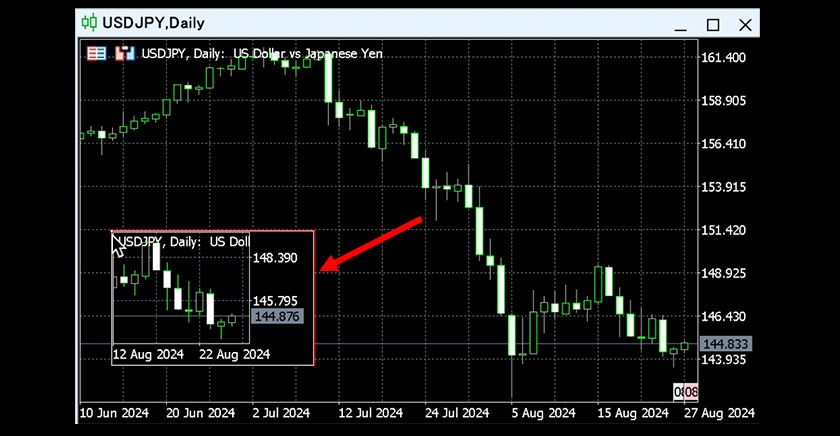
The mini chart will be displayed.
Adjusting the Mini Chart Display
Moving the Mini Chart with the Mouse
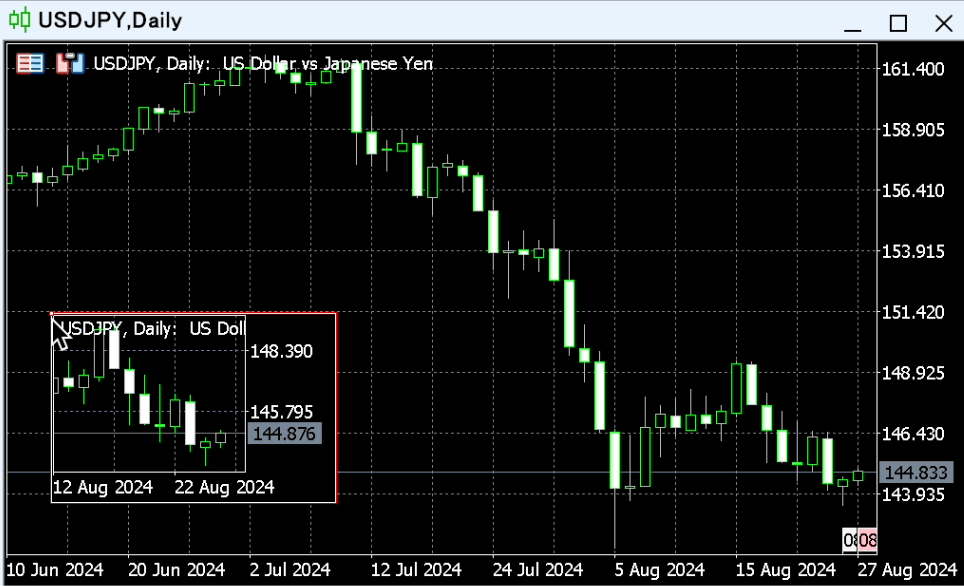
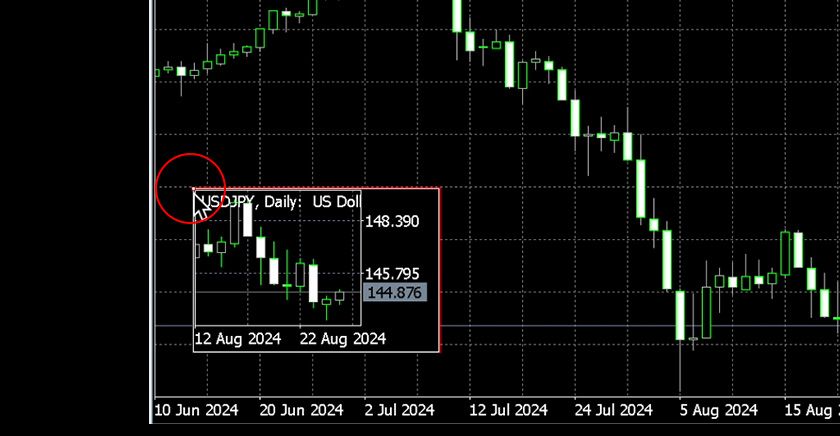
Double-click the mini chart to select it, then drag the small square that appears in the top left corner to move it.
Adjusting from the Object List
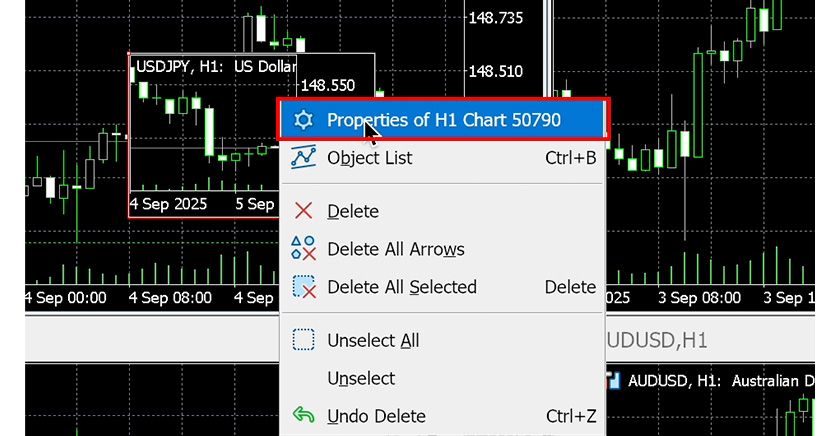
Right-click on the chart and select "Object List".
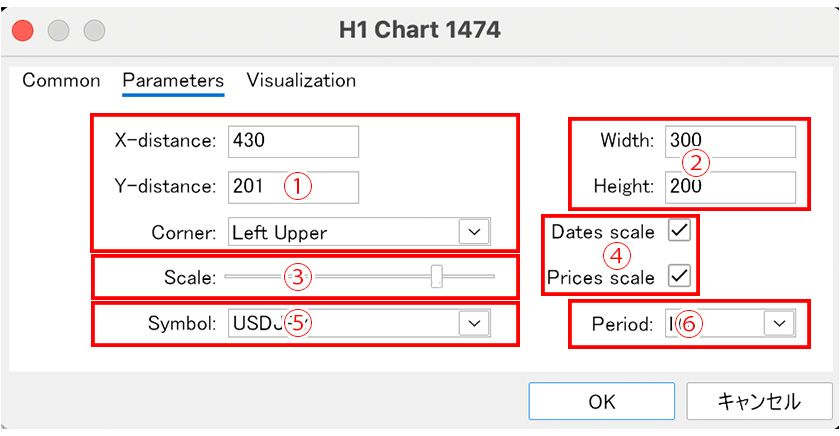
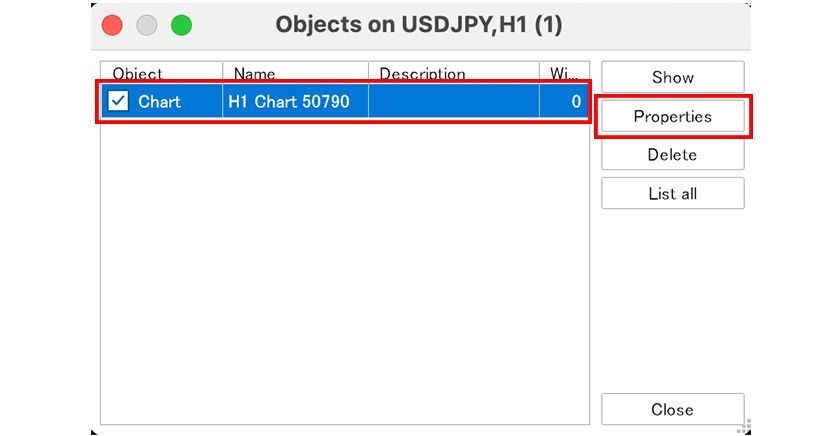
Select the relevant "Chart" from the list and click "Properties".
In the "Parameters" tab of the window that appears, you can adjust the display position (①), size (②), zoom (③), scale display (④), symbol (⑤), and timeframe (⑥).