Bearish Candlestick Patterns:Hanging Man & Three Black Crows
The Hanging Man and Three Black Crows candlestick patterns are commonly seen in stock market analysis, but they are equally applicable to forex market technical analysis.
Due to the volatility and global nature of the forex market, these patterns provide traders with important tools for identifying potential price reversal points, helping them make more precise trading decisions across a wide range of currency pairs.
This article aims to delve into how these two candlestick patterns can be applied in technical analysis, assisting traders in identifying potential market peaks and optimizing trading strategies to capitalize on every market turn, allowing traders to steadily navigate the complex and fluctuating financial markets.
- Bearish candles signal a possible turn from uptrend to downtrend
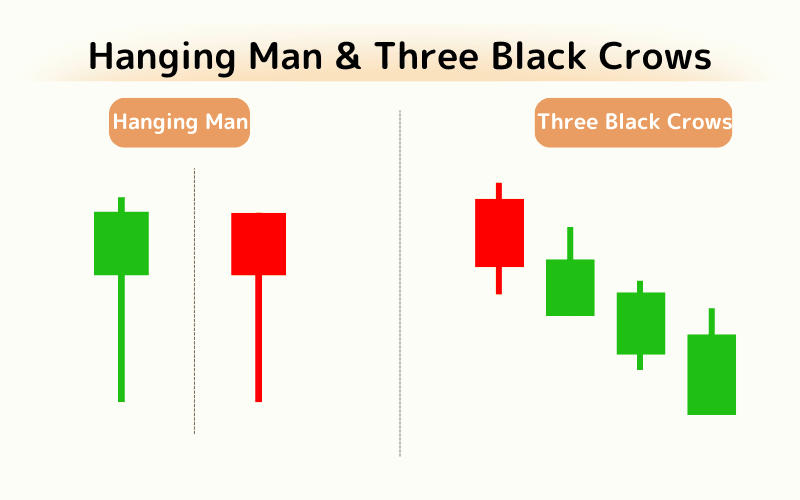
- Hanging Man: one candle at an uptrend's top with a long lower wick — fading buyers
- Three Black Crows: three down candles closing lower each time — a strong bearish reversal
- They appear near highs, warning of tops and trend reversals
- Combine with volume, moving averages, and support/resistance for accuracy
1. Hanging Man
The Hanging Man pattern is almost identical to the Hammer candlestick, with the key difference being that the Hammer often appears during a downtrend, while the Hanging Man appears at the end of an uptrend.
The Hanging Man represents indecision and uncertainty in the market after a period of rising prices. The long lower shadow indicates that, although the price was pushed lower during the session, the close is near the open, suggesting that buyers were unable to maintain the upward momentum.
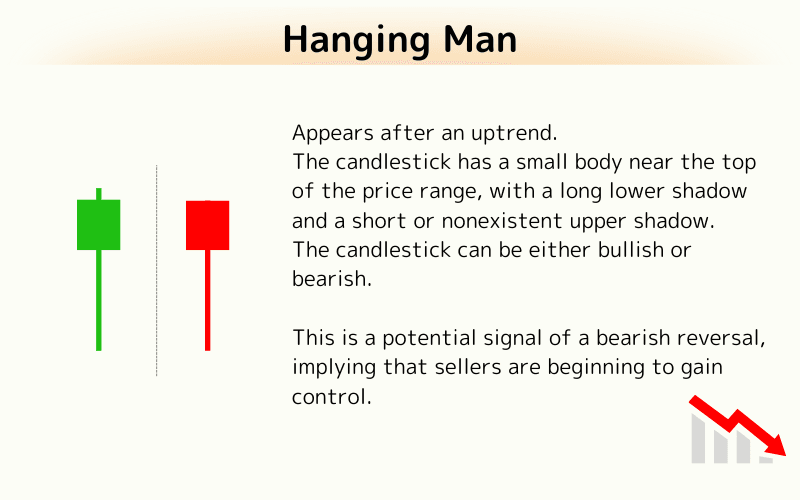
This is a potential signal of a bearish reversal, implying that sellers are beginning to gain control.
Hanging Man Characteristics:
- Appears after an uptrend.
- The candlestick has a small body near the top of the price range, with a long lower shadow and a short or nonexistent upper shadow.
- The candlestick can be either bullish or bearish.
2. Three Black Crows
The Three Black Crows pattern is characterized by three consecutive bullish candlesticks, where each candlestick closes lower than the previous one. This is why the pattern is referred to as "Three Black Crows."
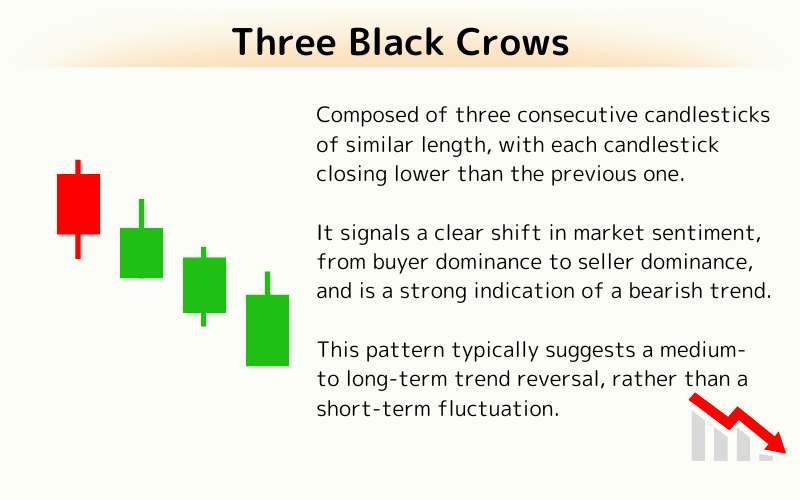
It signals a clear shift in market sentiment, from buyer dominance to seller dominance, and is a strong indication of a bearish trend.
This pattern typically suggests a medium- to long-term trend reversal, rather than a short-term fluctuation.
Three Black Crows Characteristics:
- Composed of three consecutive candlesticks of similar length, with each candlestick closing lower than the previous one.
- Appears after an uptrend.
3. Frequently Asked Questions (FAQ)
Q1: Does a bearish pattern guarantee a drop?
No. It is a probabilistic reversal signal — wait for confirmation from the next candles and combine it with other indicators rather than acting on a single pattern.
Q2: How do I tell a Hanging Man from a Hammer?
They look alike, but the Hanging Man appears at the top of an uptrend (bearish) while the Hammer appears at the bottom of a downtrend (bullish). The location defines the meaning.
Q3: Do these patterns work in the forex market?
Yes. Forex's high volatility and liquidity keep candlestick patterns effective, but watch for false signals around major data releases and session-specific volatility.
4. Conclusion
The Hanging Man and Three Black Crows candlestick patterns provide clear warning signals of bearish trends in markets such as forex and stocks.
By recognizing these key signals, investors can identify market turning points in a timely manner, optimize their trading decisions, and stay ahead in volatile markets.
Combining these patterns with other analysis tools (such as volume and moving averages) can further enhance the accuracy of trend recognition.
Further Reading
- What Is a Candlestick Chart?
- Pros and Cons of Candlestick Charts
- What Is a Moving Average (MA)?
- Technical Analysis Explained
- Three White Soldiers & Three Black Crows
Titan FX Research Team. We cover a broad set of financial instruments — foreign exchange, commodities (crude oil, precious metals, agricultural products), equity indices, US equities, and digital assets — producing practical, research-backed educational content for investors.
Primary Sources (by Category)
- Technical analysis theory: Steve Nison, "Japanese Candlestick Charting Techniques" (1991), and others
- Platform tools: Titan FX Technical Indicators