Bullish Reversal Candlestick Patterns in Trading
Bottom (bullish reversal) candlestick patterns appear near the end of a downtrend and signal that price may turn upward. The four most common are the Hammer, the Inverted Hammer, the Bullish Engulfing, and the Morning Star.
These patterns help traders spot potential turning points before price rebounds. This article breaks down the candlestick structure, market meaning, and use of each of the four bottom reversal patterns.
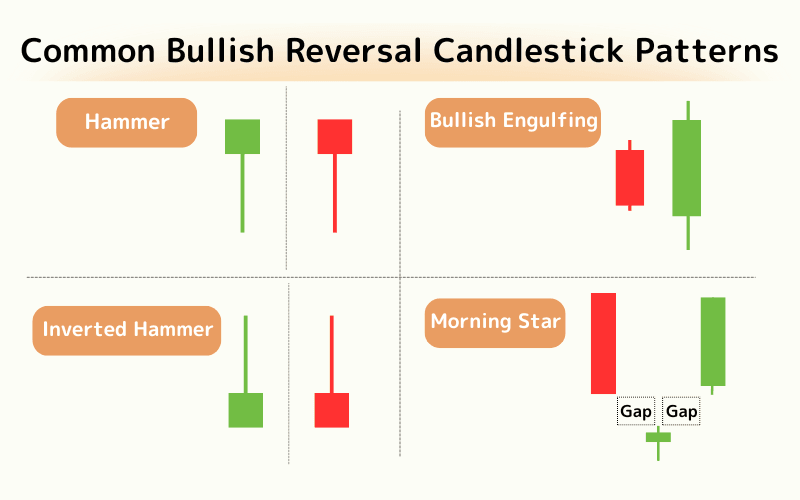
- Bottom reversal patterns appear at the end of a downtrend and hint at an upward turn
- Hammer: a single candle with a small body and long lower shadow, little to no upper shadow
- Inverted Hammer: a small body with a long upper shadow; needs confirmation from the next candle
- Bullish Engulfing: a large bullish candle fully engulfs the prior small bearish one — a strong reversal
- Morning Star: a three-candle sequence (long bearish, small body, long bullish) marking a bottom
1. Hammer
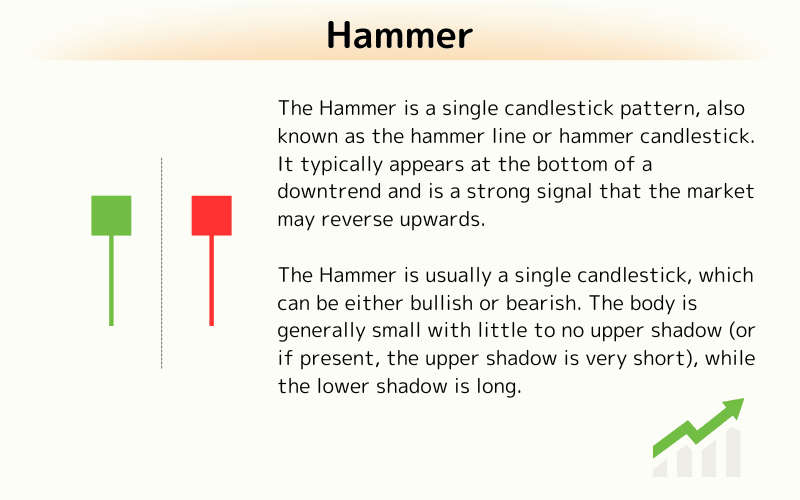
The Hammer is a single candlestick pattern, also known as the hammer line or hammer candlestick. It typically appears at the bottom of a downtrend and is a strong signal that the market may reverse upwards.
The Hammer is usually a single candlestick, which can be either bullish or bearish. The body is generally small with little to no upper shadow (or if present, the upper shadow is very short), while the lower shadow is long.
2. Inverted Hammer
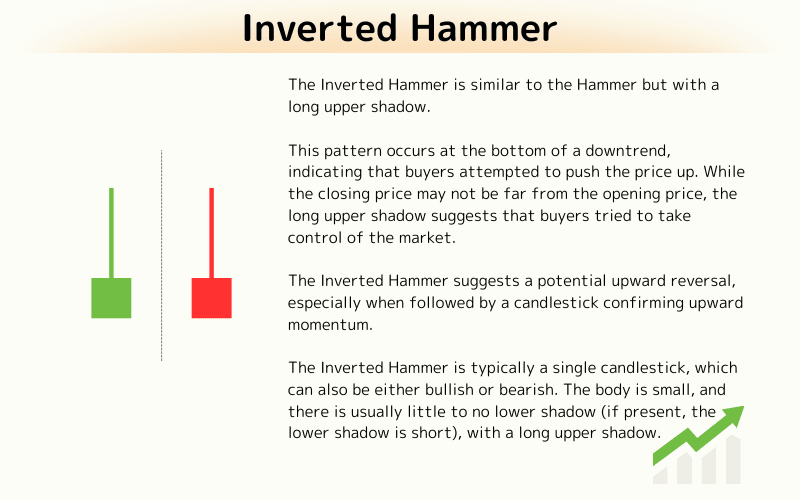
The Inverted Hammer is similar to the Hammer but with a long upper shadow.
This pattern occurs at the bottom of a downtrend, indicating that buyers attempted to push the price up. While the closing price may not be far from the opening price, the long upper shadow suggests that buyers tried to take control of the market.
The Inverted Hammer suggests a potential upward reversal, especially when followed by a candlestick confirming upward momentum.
The Inverted Hammer is typically a single candlestick, which can also be either bullish or bearish. The body is small, and there is usually little to no lower shadow (if present, the lower shadow is short), with a long upper shadow.
3. Bullish Engulfing
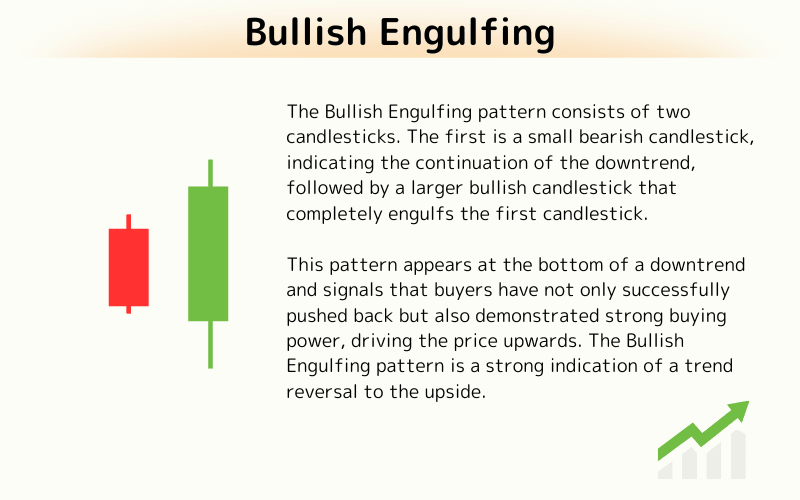
The Bullish Engulfing pattern consists of two candlesticks. The first is a small bearish candlestick, indicating the continuation of the downtrend, followed by a larger bullish candlestick that completely engulfs the first candlestick.
This pattern appears at the bottom of a downtrend and signals that buyers have not only successfully pushed back but also demonstrated strong buying power, driving the price upwards. The Bullish Engulfing pattern is a strong indication of a trend reversal to the upside.
4. Morning Star
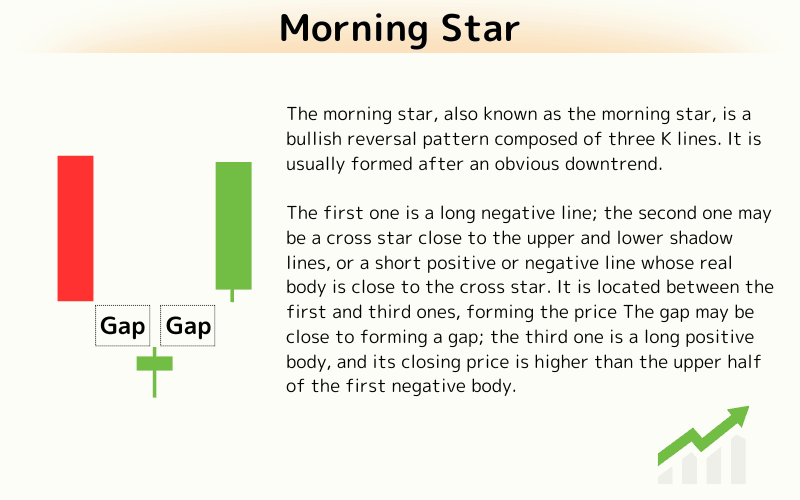
The Morning Star is a three-candlestick pattern that signals a potential market reversal after a downtrend. It begins with a long bearish candlestick (either red or black), followed by a small-bodied candlestick, which could be either bullish or bearish, representing market indecision. The third candlestick is a long bullish candlestick (either green or white), clearly indicating that buyers have taken control of the market.
The appearance of the Morning Star symbolizes the end of the "night" and the beginning of a new phase, suggesting that the price will likely trend upwards.
The Morning Star is also known as the "Morning Star" or "Hope Star" and is a bullish reversal pattern formed after a clear downtrend.
- The first candlestick is a long bearish body, showing that sellers control the market.
- The second candlestick is a Doji or a small candlestick, possibly with a gap or close to forming one, indicating market uncertainty.
- The third candlestick is a long bullish candlestick whose close price is above the midpoint of the first bearish candlestick, reflecting that buyers are now in control of the market and pushing the price higher.
The appearance of this pattern symbolizes a ray of hope after a downtrend, signaling that the market may be undergoing a significant reversal from a bearish to a bullish market.
5. Frequently Asked Questions
Q1. Does a bottom pattern always lead to a reversal?
Not always. These patterns only signal a possible reversal. Combine them with volume, position within the trend, and confirmation from the next candle, and manage risk carefully to avoid false breakouts.
Q2. Which of the four bottom patterns is most reliable?
None is reliable in absolute terms. Multi-candle patterns like the Bullish Engulfing and Morning Star generally carry stronger signals than the single-candle Hammer or Inverted Hammer, but you still need to weigh position and volume.
Q3. How can I improve the accuracy of bottom patterns?
Combine them with support levels, rising volume, trendlines, and other indicators (such as RSI divergence and moving averages), and wait for the next candle to confirm before entering.
6. Conclusion
Bottom reversal candlestick patterns are a practical tool for spotting trend reversals in technical analysis. The Hammer, Inverted Hammer, Bullish Engulfing, and Morning Star each have their own structure and market meaning, but no single pattern is foolproof — always combine them with trend position, volume, and other indicators, and apply strict stop-loss and risk management to improve your real-world odds.
Further Reading
- What Is a Candlestick Chart?
- What Are Reversal Patterns?
- Topping Candlestick Patterns
- Introduction to Technical Analysis
The financial markets research team at Titan FX. We produce educational content across a broad range of instruments, including forex (FX), commodities (crude oil, precious metals, agricultural products), equity indices, U.S. stocks, and crypto assets.
Primary Sources (by Category)
- Technical analysis references: Steve Nison — Japanese Candlestick Charting Techniques; Thomas N. Bulkowski — Encyclopedia of Candlestick Charts; Investopedia — Hammer / Morning Star / Bullish Engulfing definitions
- Trading practice: Titan FX — candlestick-pattern and technical-analysis education; major exchanges — candlestick data