Box Theory: Box Patterns, Drawing Methods, and Strategies

Box Theory is a technical-analysis method that identifies when price oscillates within a defined range (a "box," or rectangle) and trades a breakout above the box as a buy or below it as a sell.
Box Theory — also called Box Consolidation or the Rectangle Pattern — is a classic technical analysis tool that traders use to read range-bound consolidation and the timing of breakouts.
Box Theory was created by Nicolas Darvas, author of How I Made $2,000,000 in the Stock Market, based on his personal investment experience.
Having stood the test of more than half a century of practice, Box Theory is still widely used today, demonstrating its enduring value and effectiveness in market analysis and investment decision-making.
- What Box Theory is: a technical method for ranges where price oscillates inside a box
- Origin: created by Nicolas Darvas from his own trading ("How I Made $2,000,000...")
- Core principle: draw the box from horizontal resistance (top) and support (bottom)
- How to draw: mark clear highs and lows, and confirm breakouts with volume
- Strategy: buy a break above the box, sell a break below; cut losses on false breaks
1. What is Box Theory?
Box Theory (Box Consolidation/Rectangular Patterns) is a technical analysis method used in forex, stocks, and other financial markets. It involves identifying the "box" or "rectangular" structure formed by price movement within a specific range to predict breakout directions.
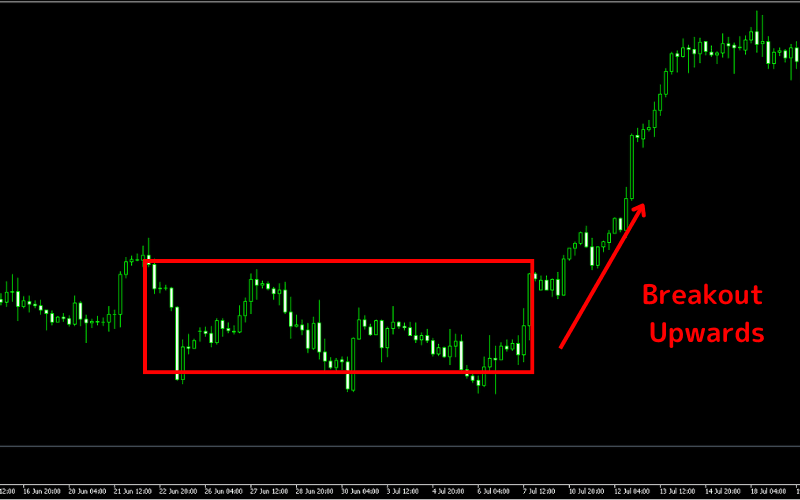
- When the price breaks through the upper boundary of the box, it is considered a buy signal, indicating that the price may rise.
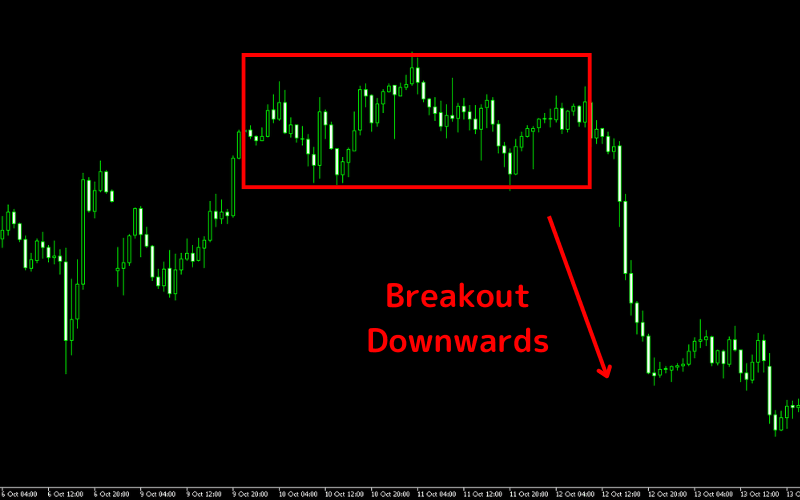
- Conversely, a break below the lower boundary is considered a sell signal, indicating that the price may fall.
This method focuses on leveraging the stability of the price range to capture investment opportunities.
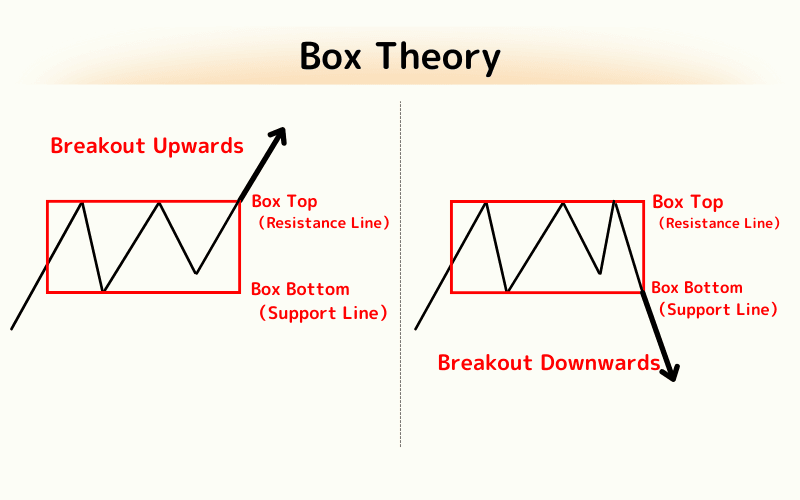
Box Theory (Box Consolidation) is divided into two types: Breakout Upwards and Breakout Downwards.
Breakout Upwards
Breakout Downwards
2. Core Principles of Box Theory
Box Theory is based on the price behavior in the stock market, viewing the price fluctuation range as a box, and using this range to predict future price movements.
When the price oscillates within a certain range, forming the upper boundary (resistance) and lower boundary (support) of the box, it reflects a balance of market forces.
Once the price breaks out of this range, it signals that the balance has been disrupted and a new trend may be forming.
3. How to Draw Box Theory Patterns
The steps to drawing a Box Theory pattern are as follows:
1. Identify the Price Range:
First, observe the chart and look for a period where the price moves sideways, ensuring that the price is confined between two parallel lines (upper and lower boundaries). These two lines represent the highest and lowest prices during this period, forming the boundaries of the box.
2. Draw the Resistance Line (Upper Boundary) and the Support Line (Lower Boundary):
Identify the highest price points during this period and connect them with a straight line. This line represents the price level that buyers are unable to break through—i.e., the upper boundary of the box.
Similarly, identify the lowest price points during this period and connect them with another straight line. This line represents the price level that sellers cannot break through—i.e., the lower boundary of the box.
3. Confirm the Box Formation:
Ensure that the upper and lower boundaries are parallel, and that the price touches both boundaries multiple times. The box typically takes time to form, during which the price fluctuates between the resistance and support lines.
4. Monitor for Breakouts:
After drawing the box, the next step is to watch for a price breakout from this range. A breakout above the upper boundary may signal the beginning of an upward trend, while a breakout below the lower boundary could signal the start of a downward trend.
4. Box Theory Trading Strategy
Since Box Patterns do not have a fixed breakout direction, the key in trading is to first observe the trend direction of 1–2 box ranges before making a decision. This can help traders act according to the breakout direction.
| Breakout Direction | Key Points | Description |
|---|---|---|
| Upward Breakout | Observe Trend | First, observe the trend direction of 1–2 box ranges, then trade according to the upward breakout. |
| Volume | Confirm an increase in volume; if volume doesn't increase, wait and observe. | |
| Buy Signal | If the price pulls back and then rises again after the breakout, it’s a buy signal. | |
| Confirm Trend | Multiple medium to long bullish candlesticks (upward movement) confirm the continuation of the upward trend. | |
| Holding Strategy | Continue holding as long as the price doesn't fall below the previous box bottom. | |
| Downward Breakout | Observe Trend | First, observe the trend direction of 1–2 box ranges, then trade according to the downward breakout. |
| Volume | Volume typically decreases during downward breakouts. | |
| Sell/Short Signal | If the price rebounds and then falls again, it’s a sell or short signal. | |
| Confirm Trend | Multiple medium to long bearish candlesticks (downward movement) confirm the continuation of the downward trend. | |
| Holding Strategy | If the price does not exceed the top of the previous box, continue holding. |
5. Frequently Asked Questions (FAQ)
Q1. Who created Box Theory?
Nicolas Darvas, a Hungarian-born dancer and investor, systematized it from his own stock-trading experience (§1).
Q2. How do I draw the box?
Connect recent clear highs into a top line and clear lows into a bottom line, framing the range price oscillates in as a rectangle (§3).
Q3. How can I avoid false breakouts?
Confirm a rising volume and a closing-price break, and wait for a retest after the break to reduce false-signal risk (§4).
Q4. Which markets does Box Theory work in?
Beyond stocks, it applies to forex, indices, and crypto — any market that trades in ranges (§2).
Q5. How does Box Theory differ from other consolidation patterns?
Triangles and flags converge or tilt, while a box has flat upper and lower bounds that price bounces between (§2).
Further Reading
- Consolidation Patterns
- Triangle Patterns
- Flag Patterns
- What Are Candlestick Charts?
- What Is a Moving Average?
Titan FX Trading Strategy Lab. We produce educational content for investors across forex, precious metals, energy, indices, US stocks, and crypto, covering technical analysis and how markets work.
Primary Sources (by Category)
- Educational & research: Investopedia, CMT Association
- Original source: Nicolas Darvas, How I Made $2,000,000 in the Stock Market