Bullish Candlestick Patterns in Forex and Stock Trading
Bullish candlestick patterns are formations of one or more candles that signal a price may begin or continue an uptrend. Common bullish setups include the slow uptrend, the bullish vanguard, three white soldiers, and the high-price side-by-side pattern — each reflecting a different buyer psychology (steady push, breakout after a test, sustained strong advance, and a gap-up continuation) and helping traders spot uptrends and time their entries.
In markets such as stocks, forex, and futures, the candlestick chart is one of the most intuitive technical-analysis tools, showing price action and the tug-of-war between buyers and sellers at a glance.
Among the many signals, bullish patterns draw particular attention. This article takes the four classic bullish formations one by one, explaining how each forms, the market psychology behind it, and how to use it in practice while avoiding false signals.
- Candlestick patterns reflect buyer vs. seller strength and help read uptrends and turns
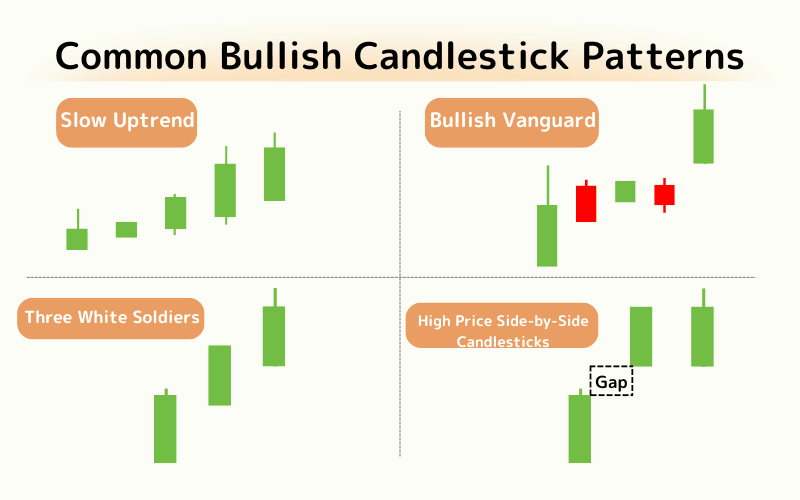
- Slow uptrend: steady, gentle rise with firm buyers and lower risk
- Bullish vanguard: upper-wick candle → consolidation → breakout candle confirms the rise
- Three white soldiers: three straight bullish candles with tiny lower wicks — strong buyers
- Side-by-side highs: bullish candles side by side after a gap — a short-term continuation signal
1. Slow Uptrend Pattern
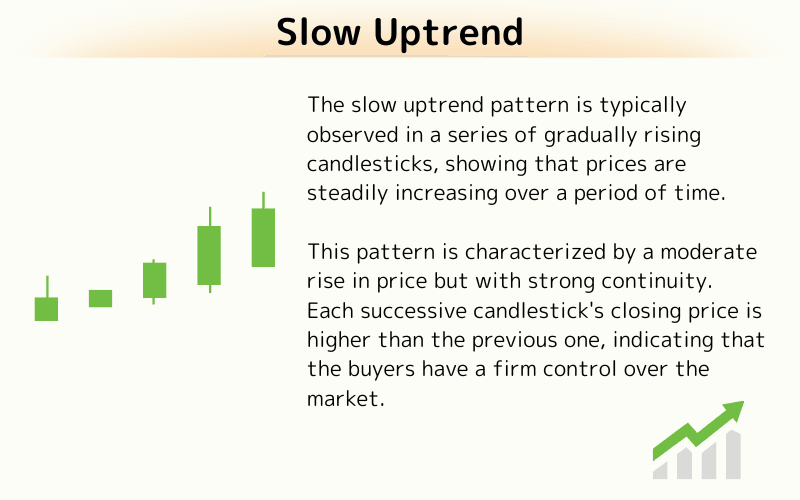
The slow uptrend pattern is typically observed in a series of gradually rising candlesticks, showing that prices are steadily increasing over a period of time.
This pattern is characterized by a moderate rise in price but with strong continuity. Each successive candlestick's closing price is higher than the previous one, indicating that the buyers have a firm control over the market.
The slow uptrend pattern usually represents persistent buying pressure that continues to drive prices higher, but since the price rise is gradual, it carries relatively lower risk.
This pattern is suitable for investors who seek more stable returns with lower volatility.
2. Bullish Vanguard Pattern
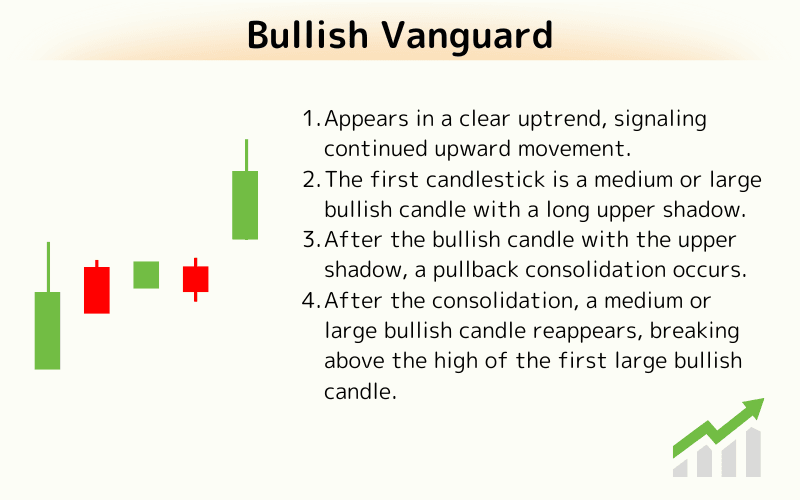
The bullish vanguard pattern appears in the market's uptrend. It starts with a candlestick that has a long upper shadow, signaling active buying but also representing a market test.
After this candlestick, the market enters a short consolidation phase with a few small bearish and bullish candlesticks near the closing price of the first candlestick. This phase represents a subtle shift in market sentiment, preparing for the next strong upward move.
The market then breaks out with a large bullish candlestick or a medium-sized one, successfully surpassing the high of the initial candlestick. This clearly indicates that buyers have gained full control over the market.
This breakout not only confirms the continuation of the bullish trend but also strengthens the expectation of further upward movement.
3. Three White Soldiers Pattern
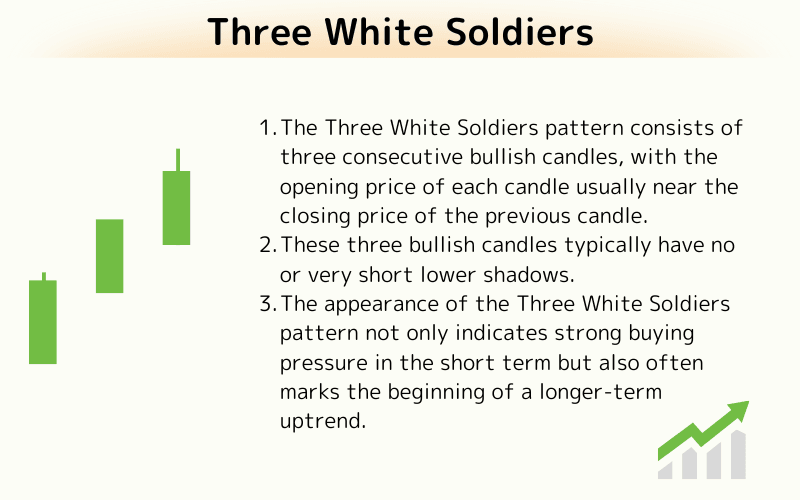
The three white soldiers pattern consists of three consecutive bullish candlesticks, all of similar length, indicating that buyers maintained control over the market for three consecutive trading periods.
Each candlestick's opening price is typically near the closing price of the previous candlestick, reflecting ongoing buying momentum.
These three candlesticks usually have little to no lower shadows, meaning that the selling pressure during this period is minimal, and buyers are able to push prices near the highest points for each period.
This characteristic reinforces the presence of a bull market and highlights the clear dominance of buyers.
The appearance of the three white soldiers pattern signals strong bullish momentum in the short term and is often the beginning of a longer-term upward trend.
This pattern reflects the market's optimistic expectations for future price movements, and traders can use it as a signal to hold or buy further positions.
4. High Price Side-by-Side Candlestick Pattern
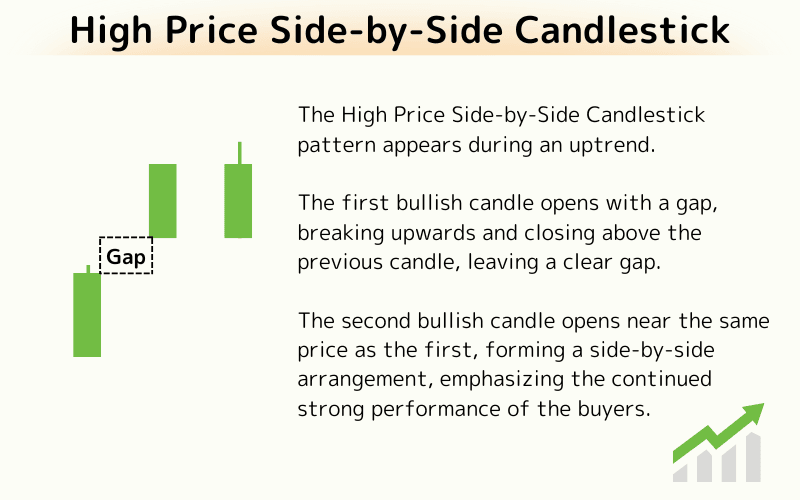
The high price side-by-side candlestick pattern is a crucial signal that appears in an uptrend and is made up of two or more consecutive bullish candlesticks.
The pattern starts with a bullish candlestick that gaps up, closing significantly higher than the previous candlestick, creating a clear upward gap. This indicates strong buying interest as buyers push prices higher.
The second candlestick is almost identical to the first one in terms of opening price, further confirming the strength of buying control and upward market momentum.
This pattern suggests that the price will likely remain strong in the short term, providing a bullish trading signal. Traders should continue to expect higher prices and stay optimistic about the market's future performance.
5. FAQ
Q1: Does a bullish pattern guarantee the price will rise?
No. A pattern is a probability-raising signal, not a guarantee. Always confirm with volume, trend direction, and other indicators, and place a stop-loss to manage risk.
Q2: How do three white soldiers differ from the bullish vanguard?
Three white soldiers are three consecutive candles of similar strength. The bullish vanguard is a "test candle → brief consolidation → breakout candle" structure that emphasizes the build-up before the break.
Q3: Which markets do these patterns suit?
They work in any market with candlestick charts — stocks, forex, futures — across timeframes, but signals are generally more reliable in high-liquidity markets.
Q4: How can I reduce false signals?
Confirm with multiple conditions — rising volume, key support/resistance, and moving-average direction — rather than entering on a single pattern alone.
6. Conclusion
Bullish candlestick patterns are valuable tools for reading uptrends. The slow uptrend reflects steady buying, the bullish vanguard emphasizes a breakout after a test, three white soldiers show a sustained strong advance, and the side-by-side highs signal continuation after a gap.
Each pattern suits a different context, but none guarantees a rise. In practice, confirm them with multiple conditions — volume, support and resistance, and moving averages — and apply disciplined stop-losses and money management to turn pattern signals into sound trading decisions.
Further Reading
Titan FX's financial-market research team. We cover a broad set of instruments — foreign exchange, commodities (crude oil, precious metals, agricultural products), equity indices, US equities, and digital assets — producing educational content for investors.
Primary Sources (by Category)
- Candlesticks & patterns: Investopedia — Candlestick, Investopedia — Three White Soldiers
- Technical-analysis references: StockCharts — Candlestick Patterns