Diamond Pattern: Features & Trading Strategies

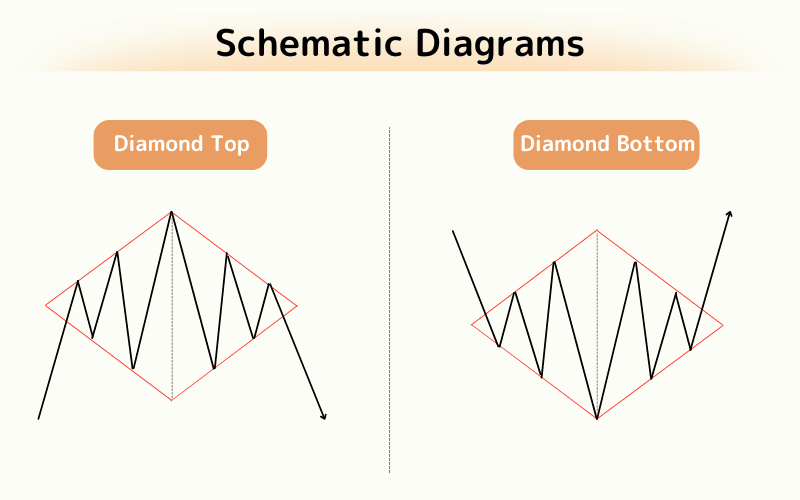
The Diamond Pattern is a relatively rare reversal signal in technical analysis, named for the diamond shape that forms as price first expands then converges; it comes in a "Diamond Top" at highs and a "Diamond Bottom" at lows, with the breakout direction guiding entries.
The Diamond Pattern, also known as the "Diamond Formation," is a relatively rare but highly indicative reversal signal in technical analysis.
It typically appears at significant turning points in stocks, forex, and futures markets, with the potential to signal market highs or lows.
This pattern gets its name from the diamond shape it forms on the chart, consisting of two types: the Diamond Top and Diamond Bottom, each indicating a reversal at the market's peak and trough, respectively. This article will explore the structure, formation mechanism, and trading strategies associated with the Diamond Pattern.
- Definition: a rare reversal pattern that expands then converges into a diamond
- Two types: Diamond Top at highs (bearish), Diamond Bottom at lows (bullish)
- Confirmation: the direction in which price breaks the diamond boundary
- Target: project the diamond's max height from the breakout point
- Caution: it can also be a continuation pattern; watch volume and use stops
1. Diamond Top Pattern
Structure
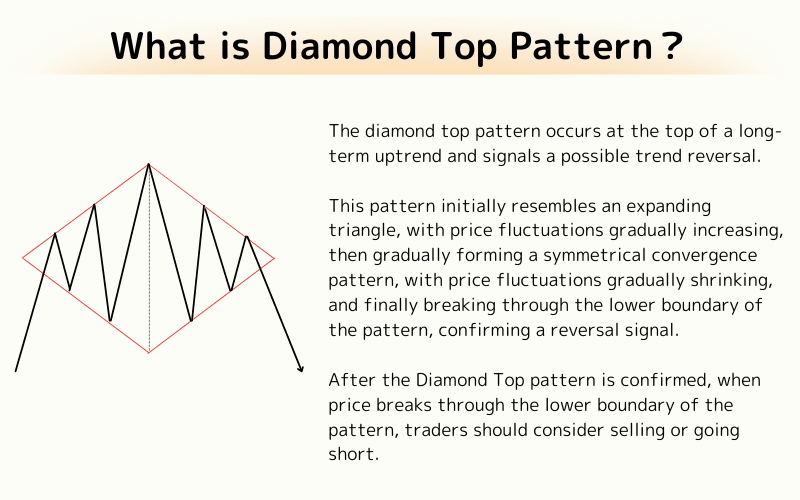
The Diamond Top pattern occurs at the peak of a long-term uptrend, signaling a potential trend reversal.
This pattern begins similarly to an expanding triangle, with the price fluctuations gradually increasing. It then forms a symmetrical convergence pattern where price fluctuations start to shrink. Ultimately, the price breaks below the lower boundary of the pattern, confirming the reversal signal.
Trading Strategy
Once the Diamond Top pattern is confirmed (i.e., the price breaks below the lower boundary), traders should consider selling or shorting.
A stop-loss can be set just above the highest point of the diamond to control potential losses.
The target price can be determined by measuring the maximum height of the diamond and replicating that distance downward from the breakout point.
2. Diamond Bottom Pattern
Structure
The Diamond Bottom pattern typically forms after a long-term downtrend, signaling a potential upward trend.
Initially, the price fluctuations increase, forming a wider diamond shape. Over time, the fluctuations decrease, and the price eventually breaks above the upper boundary of the pattern, indicating a potential upward trend reversal.
Trading Strategy
When the Diamond Bottom pattern is confirmed by a breakout above the upper boundary, investors should consider buying or going long.
A stop-loss can be placed just below the lowest point of the diamond, while the target price can be estimated by measuring the total height of the diamond and replicating that distance upward from the breakout point.

3. Considerations for Diamond Reversal Patterns
While the primary focus of the Diamond Pattern is on trend reversal, it is important to note that in some cases, the pattern can signal a continuation of the existing trend.
The Diamond Continuation and Diamond Reversal patterns share similar visual characteristics, but the key difference lies in the direction of the breakout.
In a continuation pattern, the diamond formation initially appears to suggest a trend reversal, but the price eventually breaks out in the direction of the prevailing trend, confirming the continuation of that trend.
1.Confirm the Trend:
Identifying whether the major trend before the formation of the diamond pattern was bullish or bearish is crucial for predicting the breakout direction.
2.Monitor Volume:
Changes in volume can provide clues about the authenticity of the breakout. In continuation patterns, breakouts tend to be accompanied by an increase in volume.
3.Trade Setup at Breakout Point:
If the diamond pattern breaks in the direction of the original trend (upward for an uptrend, downward for a downtrend), consider trading near the breakout point to capitalize on the continuation of the trend.
4.Set Appropriate Risk Management Measures:
Use stop-loss orders to limit potential losses. The stop-loss point can be set near the potential reversal point if the breakout fails.
4. FAQ
Q1. How do I tell a Diamond Top from a Diamond Bottom?
A Diamond Top forms at the peak of an uptrend and signals a downward reversal, confirmed by a break below the lower boundary. A Diamond Bottom forms at the bottom of a downtrend and signals an upward reversal, confirmed by a break above the upper boundary. Location and breakout direction are the keys.
Q2. How do I confirm whether a breakout is valid?
Check that the breakout comes with a clear increase in volume and that price holds beyond the boundary (e.g., a confirmed close) to avoid false breakouts. Combine with other indicators and the prior trend.
Q3. How do I distinguish reversal from continuation diamonds?
They look alike; the deciding factor is breakout direction. A break in the direction of the prior trend means continuation, while a break against it means reversal. Always confirm with the prior trend and volume.
Further Reading
Titan FX Research Team — investor-education content across forex, commodities (oil, precious metals, agriculture), stock indices, U.S. equities, and crypto assets.
Primary Sources (by Category)
- Technical analysis theory: Investopedia — Diamond Top/Bottom
- Chart research: Thomas Bulkowski — Encyclopedia of Chart Patterns