Double Top and Bottom Patterns: Features and Strategies

A Double Top is a bearish reversal pattern in which price forms two similar highs in an "M" shape, while a Double Bottom is a bullish reversal forming two similar lows in a "W" shape; both are confirmed by a break of the neckline.
In forex, stock markets, and other financial markets, the Double Top and Double Bottom patterns are iconic candlestick reversal patterns. These patterns play a crucial role in predicting significant market trend reversals.
This article provides an in-depth analysis of these two reversal patterns, revealing their importance in technical analysis and how traders can apply this knowledge to capture potential entry and exit opportunities.
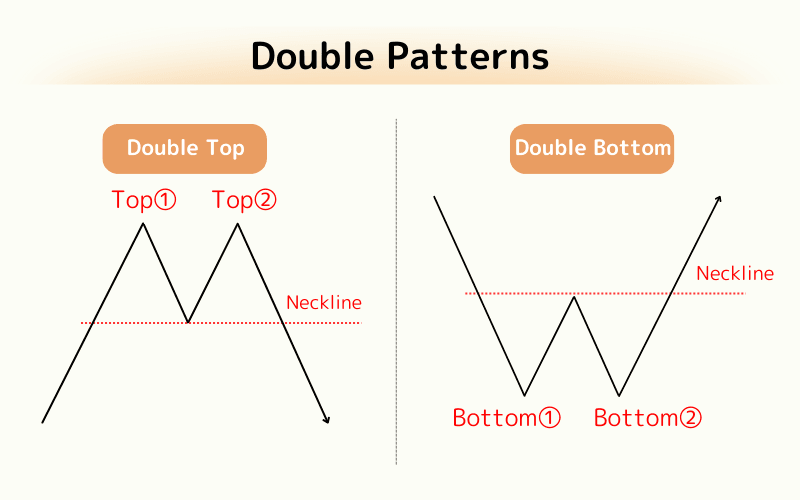
- Double Top: a bearish 'M'-shaped reversal that forms at the top of an uptrend
- Double Bottom: a bullish 'W'-shaped reversal that forms at the bottom of a downtrend
- Neckline: the line that confirms the pattern; a break triggers the trade signal
- Profit target: project the high-to-neckline distance in the breakout direction
- Avoiding false signals: trade only high-probability setups and confirm with volume
1. What Is a Double Top?
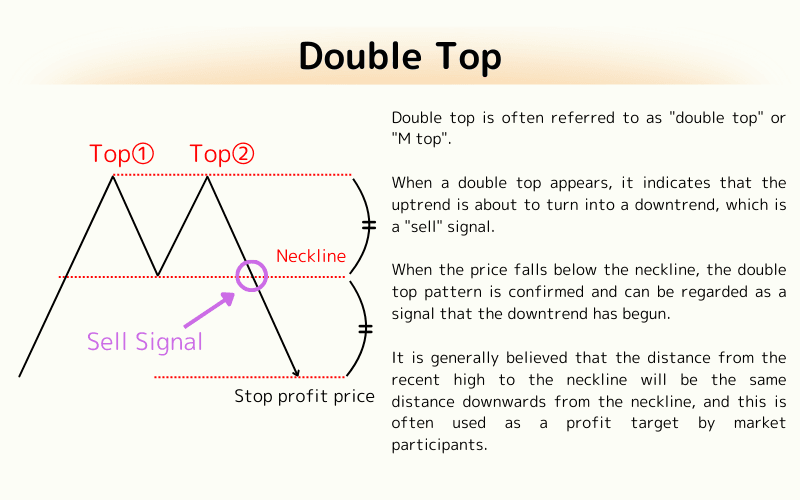
A Double Top is a common bearish reversal pattern characterized by the market reaching two nearly identical highs separated by a distinct decline, forming an "M" shape.
Often referred to as "Double Top" or "M Top," this pattern signals that the market has failed twice to break through a specific price level. It reflects waning buyer momentum and increasing seller dominance, indicating the end of an uptrend and the potential beginning of a downtrend.
The key to confirming a Double Top pattern is observing a break below the low point (neckline) between the two peaks, which is typically seen as a sell signal.
Sell Signal of the Double Top
The appearance of a Double Top suggests an imminent trend reversal from an uptrend to a downtrend, signaling a "sell" opportunity.
When the price breaks below the neckline, the Double Top pattern is considered complete and indicates the start of a downtrend.
It is generally believed that the distance from the recent high to the neckline will mirror the expected price drop below the neckline, often serving as a profit target for traders.
2. What Is a Double Bottom?
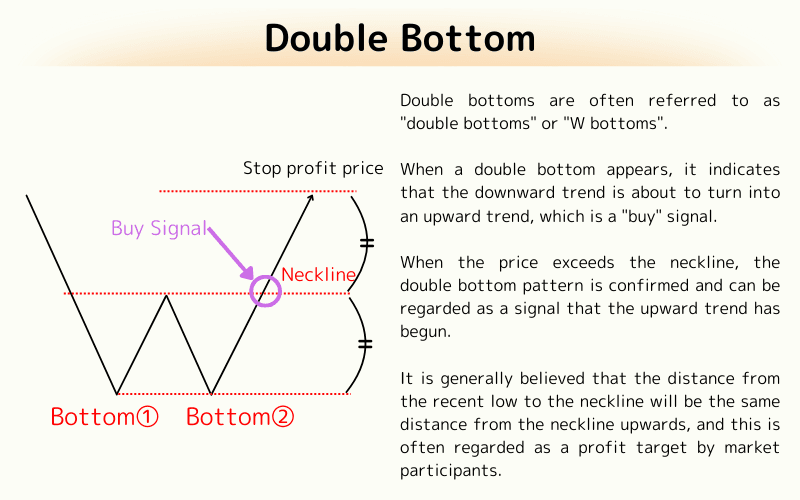
In contrast, a Double Bottom is a bullish reversal pattern characterized by the market forming two nearly identical lows separated by a distinct rise, creating a "W" shape.
Often referred to as "Double Bottom" or "W Bottom," this pattern indicates that sellers failed to sustain a price drop at a certain level, while buyers gained control, suggesting the end of a downtrend and the potential start of an uptrend.
The key to confirming a Double Bottom pattern is observing a break above the high point (neckline) between the two troughs, which is typically seen as a buy signal.
Buy Signal of the Double Bottom
The appearance of a Double Bottom suggests an imminent trend reversal from a downtrend to an uptrend, signaling a "buy" opportunity.
When the price breaks above the neckline, the Double Bottom pattern is considered complete and indicates the start of an uptrend.
It is generally believed that the distance from the recent low to the neckline will mirror the expected price rise above the neckline, often serving as a profit target for traders.
3. The Neckline
The neckline serves as the support line for a Double Top and the resistance line for a Double Bottom.
As noted earlier, a Double Top is confirmed when the second decline breaks below the neckline. Similarly, a Double Bottom is confirmed when the second rise breaks above the neckline.
4. Strategies to Avoid False Signals
While Double Top and Double Bottom patterns provide valuable trading signals, traders should be cautious of "false signals."
A false signal occurs when the market appears to rise but does not, or seems to fall but does not. Although there is no foolproof method to avoid false signals, traders can reduce the risk by observing where these patterns appear and trading only in scenarios with higher probabilities of success.
Double Tops near resistance levels and Double Bottoms near support levels are more likely to follow the theoretical pattern, improving the odds of successful trades.
5. Frequently Asked Questions (FAQ)
Q1. What is the difference between a Double Top and a Double Bottom?
A Double Top is a bearish "M"-shaped reversal that forms after an uptrend, while a Double Bottom is a bullish "W"-shaped reversal that forms after a downtrend (§1, §2).
Q2. When is the pattern confirmed?
The pattern is confirmed when price decisively breaks the neckline — downward for a Double Top and upward for a Double Bottom (§3).
Q3. How do I measure the profit target?
Measure the vertical distance from the high (or low) to the neckline and project that same distance in the breakout direction (§1, §2).
Q4. How can I avoid false signals?
Trade only high-probability setups — Double Tops near resistance and Double Bottoms near support — and confirm with volume and other signals (§4).
Q5. How is the neckline drawn?
For a Double Top, connect the low between the two peaks (support); for a Double Bottom, connect the high between the two troughs (resistance) (§3).
Further Reading
- What Are Candlestick Charts?
- What Are Reversal Patterns?
- Head and Shoulders Top & Bottom
- Triangle Patterns
- Neckline
The financial markets research team at Titan FX. We produce educational content across a broad range of instruments, including forex (FX), commodities (crude oil, precious metals, agricultural products), equity indices, U.S. stocks, and crypto assets.
Primary Sources (by Category)
- Educational & research: Investopedia, CMT Association
- Market & data: Bloomberg, Reuters, and TradingView chart analysis and commentary