Flag Patterns: Features, Analysis Methods and Strategies

A flag pattern is a short consolidation within a strong trend, made of a "flagpole" and a "flag"; a breakout from the flag usually signals the prior trend resuming, in either bullish or bearish form.
After a sharp rally or sell-off, price often pauses to consolidate — and the flag is one of the most recognisable, beginner-friendly of these patterns, widely used in technical analysis across forex and stocks. These patterns typically occur during the trend formation process, especially after a small pullback in the trend.
Once the price breaks out of the flag pattern area, it often signals that the prevailing trend will continue.
Because flag patterns can be identified before a trend continuation, they are particularly useful for beginners to capture trend continuation opportunities and profit from them.
This article comprehensively explores the structure, types, and practical applications of flag patterns, aiming to enhance trading decision-making efficiency and accuracy.
- What it is: a short consolidation within a strong trend — a continuation pattern
- Two parts: flagpole (sharp move) + flag (narrow consolidation)
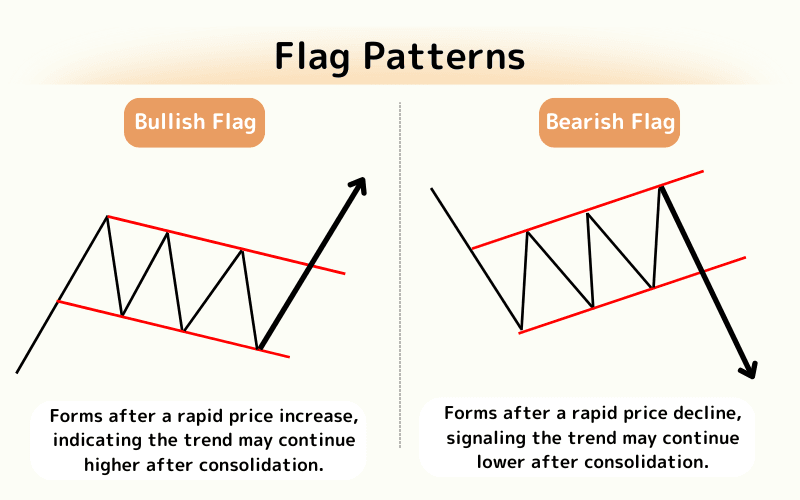
- Two directions: bullish flag (tilts down) / bearish flag (tilts up)
- Entry: a breakout from the flag, confirmed by rising volume
- Risk control: place the stop on the opposite side of the flag; confirm with other tools
1. What Are Flag Patterns?
A flag pattern is an important chart pattern commonly seen in the charts of stocks, forex, and other financial markets.
This pattern is named after the shape of a fluttering flag and consists of two main parts: a sharp price movement (the flagpole) followed by a smaller, parallel price consolidation area (the flag).
Flag patterns can be either bullish (upward) or bearish (downward) and typically signify a brief pause in the market after a strong price move, indicating that the previous trend may resume after the flag pattern.
Flag Pattern Components
Flag patterns are made up of two main parts, reflecting a brief pause in the market after a strong trend.
1. Flagpole
The flagpole is the sharp and straight price movement that occurs before the flag pattern.
This represents strong buying or selling momentum in the market, causing the price to rise or fall sharply in a short period.
The length of the flagpole can be an indicator of the potential price movement that may follow.
2. Flag
The flag is the phase after the flagpole, where the price starts to experience small fluctuations or pullbacks, forming a rectangular or slightly slanted narrow channel.
The flag is made up of a series of shorter candlesticks, where the price moves up and down, but overall stays within two parallel or slightly converging trendlines.
The flag reflects a temporary consolidation or rest after a fast price move, accumulating energy for the upcoming trend continuation.
2. Bullish Flag Pattern
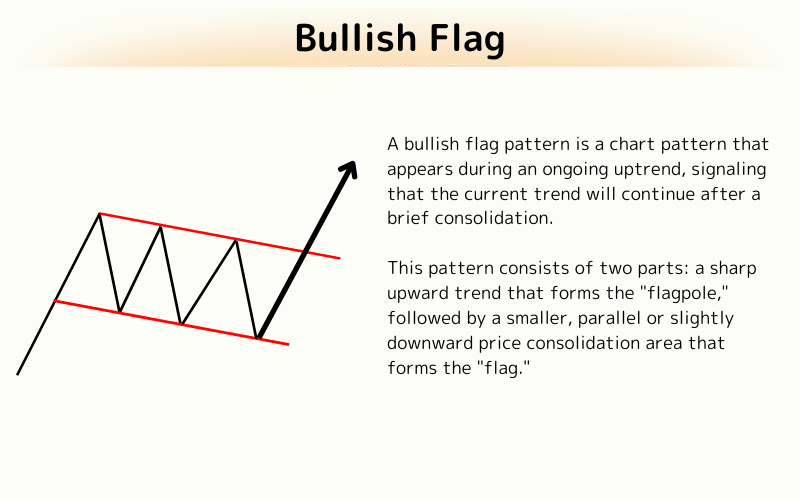
A bullish flag pattern is a chart pattern that appears during an ongoing uptrend, signaling that the current trend will continue after a brief consolidation.
This pattern consists of two parts: a sharp upward trend that forms the "flagpole," followed by a smaller, parallel or slightly downward price consolidation area that forms the "flag."
The consolidation area typically consists of a series of shorter candlesticks that fluctuate within a narrow price range, seemingly preparing for the next upward move.
The key feature of the bullish flag pattern is its consolidation area. While the price may dip slightly, the overall trend remains upward.
When the price eventually breaks above the upper boundary of the flag, it usually signals that the upward trend will resume, potentially continuing with the same magnitude as the "flagpole."
In trading practice, a bullish flag pattern is seen as a signal to hold or increase long positions, especially when the price breaks above the consolidation area with increased volume. However, when identifying this pattern and applying it to trading decisions, it's important to consider other market factors and technical indicators to ensure comprehensive and accurate decision-making.
3. Bearish Flag Pattern
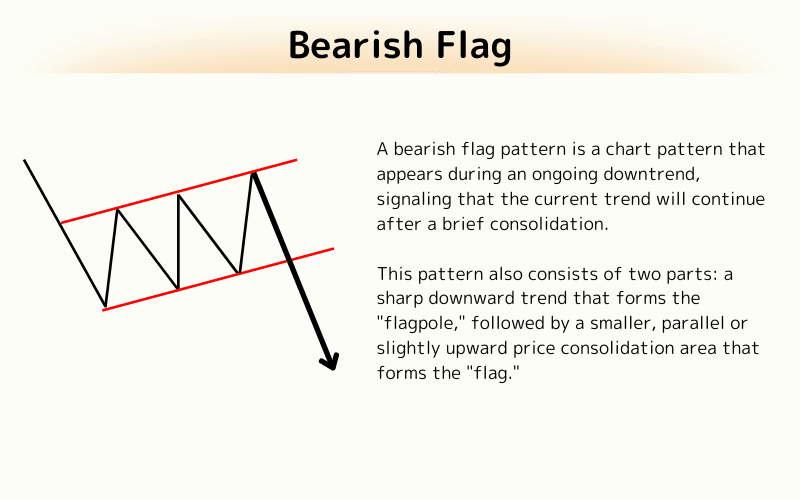
A bearish flag pattern is a chart pattern that appears during an ongoing downtrend, signaling that the current trend will continue after a brief consolidation.
This pattern also consists of two parts: a sharp downward trend that forms the "flagpole," followed by a smaller, parallel or slightly upward price consolidation area that forms the "flag."
The consolidation area typically consists of a series of shorter candlesticks, where the price fluctuates within a narrow range, seemingly preparing for the next downward move.
The key feature of the bearish flag pattern is its consolidation area. While the price may rise slightly, the overall trend remains downward.
When the price eventually breaks below the lower boundary of the flag, it usually signals that the downward trend will resume, potentially continuing with the same magnitude as the "flagpole."
In trading practice, a bearish flag pattern is seen as a signal to hold or increase short positions, especially when the price breaks below the consolidation area with increased volume. However, when applying this pattern to trading decisions, it's important to consider other market factors and technical indicators to ensure comprehensive and accurate decision-making.
4. Key Considerations When Using Flag Patterns in Trading
When using flag patterns for trading, the following four points are crucial:
1. Clear Price Breakout
Ensure that the price has clearly broken out of the flag consolidation area and use this as the trading signal.
For a bullish flag, focus on the breakout above the upper boundary; for a bearish flag, focus on the breakout below the lower boundary.
2. Volume Confirmation
A breakout should be accompanied by a noticeable increase in volume.
This increase in volume provides additional confirmation for the breakout, enhancing the likelihood of trend continuation.
3. Proper Stop-Loss Placement
After entering the trade, immediately set a stop-loss to manage risk.
The stop-loss should be placed on the opposite side of the consolidation area to limit losses in case the forecast fails.
4. Use of Additional Analytical Tools
While flag patterns themselves are strong trading signals, combining them with other technical indicators can improve trading decision accuracy. For example, trend indicators, momentum indicators, or other chart patterns can provide additional market insights.
5. Flag Pattern FAQs
Q1. How is a flag different from a pennant?
A flag's body is a parallel channel, while a pennant converges into a small triangle. Both are continuation patterns, but the shapes differ.
Q2. Does a flag breakout always continue the trend?
Not always. Confirm it with a rise in volume and place a stop-loss in case of a false breakout. See §4.
Q3. How do I project a target from the flagpole?
A common approach is to project the flagpole's length from the breakout point in the same direction as a potential target.
Q4. Which timeframes suit flag patterns?
Any timeframe works, but higher timeframes (e.g., 1-hour and above) give steadier signals with fewer false breaks.
Q5. Why is a bullish flag's body usually slightly downward?
Profit-taking after the rally causes a small pullback, forming a slightly downward consolidation before the uptrend resumes.
Further Reading
- What are candlestick charts?
- Triangle patterns
- Reversal patterns
- What is technical analysis?
- What is stop loss?
Titan FX Trading Strategy Lab. We produce investor-education content covering forex, commodities (crude oil, precious metals, agricultural goods), stock indices, U.S. equities, and digital assets.
Primary Sources (by Category)
- Charting fundamentals: General treatment of trend-continuation patterns from Dow theory and price action
- Titan FX official: Candlestick charts, Technical analysis