Price Gaps: Types, Causes, and How to Analyze and Trade Them
A price gap is a blank space on a candlestick chart where the opening price of one trading session differs sharply from the previous session's close, with no trades occurring in between. It is a key technical signal of a sudden shift in market sentiment or a reaction to a major event.
A gap shows up as an eye-catching blank on the chart, visually marking a move that happened with no trading in between. Because it captures the moment the balance between buyers and sellers tips abruptly, traders use gaps as a clue to whether a trend is reversing or continuing.
- A price gap is a blank space on a candlestick chart where price jumps with no trades in between
- Usually driven by earnings, economic data, central-bank policy or geopolitical events
- Rare in 24-hour forex (mostly Monday opens and low-liquidity pairs); frequent in stocks
- Split by direction into Gap Up and Gap Down
- Four technical types: common, breakaway, runaway and exhaustion — trend gaps resist filling
1. What Is a Price Gap?
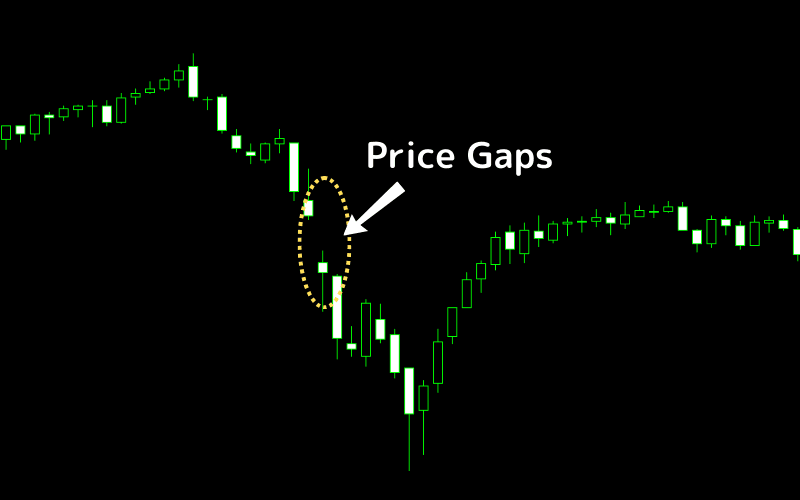
A price gap, commonly referred to simply as a gap, is a distinct blank space on a candlestick chart that occurs when the price of an asset suddenly jumps between consecutive trading sessions without any trades occurring in between.
This phenomenon highlights a significant price movement and is typically caused by major market events, such as breaking news, the release of economic data, corporate earnings reports, or other factors that drastically shift market sentiment and asset valuation.
Price gaps reveal a sharp change in the balance of power between buyers and sellers at a specific moment in time. They are closely monitored by market participants because they often signal shifts in market sentiment and can act as key indicators of potential future price trends.
2. When Do Price Gaps Occur?
Gaps are closely tied to a market's trading mechanism and to external events, so their frequency and timing differ by market type.
Gaps in the Forex Market
The forex market runs almost 24 hours a day as a global market. Major currency pairs such as USD/JPY and EUR/USD enjoy high liquidity and continuous quoting, so clear gaps are relatively rare.
However, if a major event occurs while the market is closed over the weekend — a sudden central-bank policy change, an unexpected geopolitical risk, or a surprise economic release — a gap can appear at the Monday open, as the unfilled orders that built up during the closure are reflected in price all at once.
In addition, low-liquidity pairs such as USD/TRY and USD/ZAR are more sensitive to news, so gaps tend to appear in them more often.
Gaps in the Stock Market
Compared with forex, stock-market trading hours are limited, with opens and closes only at set times on trading days. This "non-continuous trading" characteristic makes gaps far more frequent.
Any earnings report, disclosure, or macroeconomic event that lands after the close and before the next open can create a clear difference between the next day's opening price and the prior day's close, forming a gap. By observing the location and size of gaps on a stock or index chart, investors can read how market sentiment reacted to the news and use it to judge short-term trends or plan strategy.
3. Price Gaps by Direction
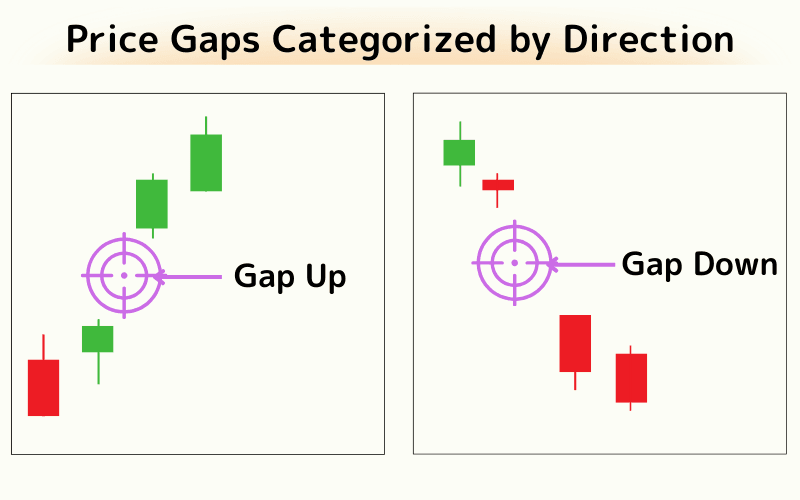
Price gaps can be classified into two types based on their direction:
- Gap Up: Indicates a breakout with prices opening significantly higher than the previous close.
- Gap Down: Indicates a breakout with prices opening significantly lower than the previous close.
Gaps can form for many reasons, but they usually arise from a sharp imbalance between buy and sell orders, which drives price to leap and leaves a gap behind.
4. Price Gaps in Technical Analysis
In technical analysis, price gaps can be classified into four main types according to where they appear and how price behaves, each carrying different market psychology and trend implications.
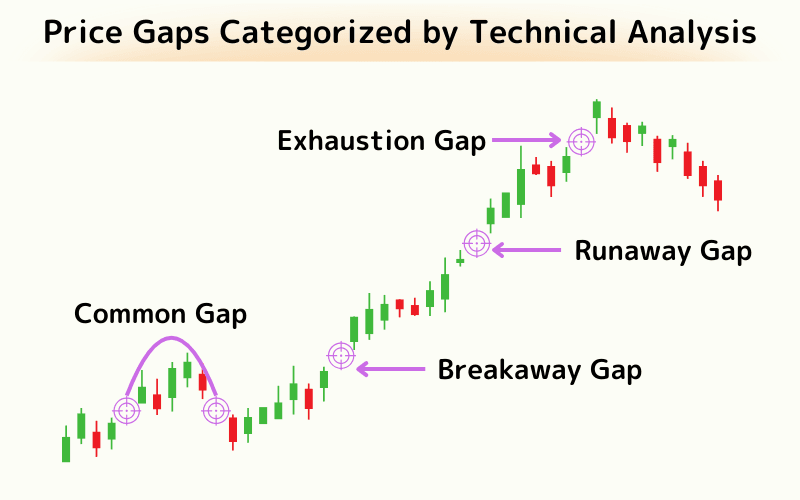
1. Common Gap
Common gaps occur due to random market fluctuations and do not indicate any specific trend. They tend to appear when there is no major news or trend change and are often quickly filled by subsequent price action, so their technical significance is relatively low.
2. Breakaway Gap
Breakaway gaps occur when prices break through a key support or resistance level, signaling the start of a new trend. They reflect a strong shift in market sentiment and are less likely to be filled quickly, often marking the beginning of a major price movement.
3. Runaway Gap
Also known as an Acceleration Gap, a runaway gap occurs during a well-established trend, indicating that momentum is accelerating. It suggests the current trend will likely continue and can be used as a guide for measuring a price target.
4. Exhaustion Gap
Also referred to as a Terminal Gap, an exhaustion gap appears near the end of a trend, signaling that the momentum driving it has weakened. It often comes with a surge in volume and serves as an early warning that a reversal or significant correction may be near.
5. Frequently Asked Questions
Q1. Will a gap always be filled?
Not necessarily. Common gaps are relatively easy to fill because they lack clear trend support, whereas trend-type gaps such as breakaway and runaway gaps can stay unfilled for a long time and may even serve as confirmation that a trend will continue.
Q2. Can I trade on gaps alone?
Relying on gaps alone is not recommended. They offer valuable clues about market sentiment, but combining them with technical indicators such as volume and moving averages, support/resistance analysis, and candlestick patterns improves accuracy and risk control.
Q3. When are gaps most likely in the forex market?
The most common gaps appear at the Monday open. Because the market is closed over the weekend, major news such as geopolitical events or central-bank decisions during that window can cause a price gap when trading resumes on Monday. The effect is even stronger in low-liquidity pairs.
6. Conclusion
Price gaps are a highly valuable pattern in technical analysis. By observing the blank areas on a price chart, traders can read shifts in market sentiment and the potential start or end of a trend.
Whether common, breakaway, runaway, or exhaustion, each type provides a different signal for trading strategy. Combining gaps with other technical tools and fundamental analysis further sharpens both judgment and risk management.
Further Reading
- What Is a Candlestick Chart?
- Introduction to Technical Analysis
- Moving Averages (MA)
- Market Sentiment Explained
The financial markets research team at Titan FX. We produce educational content across a broad range of instruments, including forex (FX), commodities (crude oil, precious metals, agricultural products), equity indices, U.S. stocks, and crypto assets.
Primary Sources (by Category)
- Technical analysis references: Investopedia — definition and classification of gaps; Thomas N. Bulkowski — Encyclopedia of Chart Patterns (gap patterns); John J. Murphy — Technical Analysis of the Financial Markets
- Market and trading mechanics: Titan FX — forex trading hours and weekend gaps; major stock exchanges — open/close mechanics and non-continuous trading sessions