Island Reversal Patterns: Features and Trading Strategies

An island reversal is a chart pattern where price is isolated like an "island" between two gaps, strongly signalling a trend reversal — a sell signal at a top and a buy signal at a bottom.
For traders, the island reversal pattern is one of the few you can read at a glance: its appearance is often a strong warning to reassess which side of the market you are on.
Although relatively rare in the forex market, island reversals still provide important decision-making signals for traders.
This article will explore the core characteristics of the island reversal pattern and its importance in trading strategies.
- An island reversal is an isolated "island" of price between two gaps
- A gap up, consolidation, then a gap down at a top is a sell signal
- A gap down, consolidation, then a gap up at a bottom is a buy signal
- The two gaps must leave no price overlap for the pattern to be valid
- Relatively rare in forex, but more reliable when volume spikes
1. What is an Island Reversal Pattern?
An island reversal, also known as an island pattern reversal, is an important chart reversal pattern widely used in technical analysis, especially in candlestick charts.
This pattern is named for its shape, which resembles an isolated "island." It typically signals that a significant market trend change is about to occur.
Island reversal patterns are short-term trend reversal signals, indicating an impending price direction shift.
Based on the location of the island reversal, it can be categorized into two distinct market signals:
-
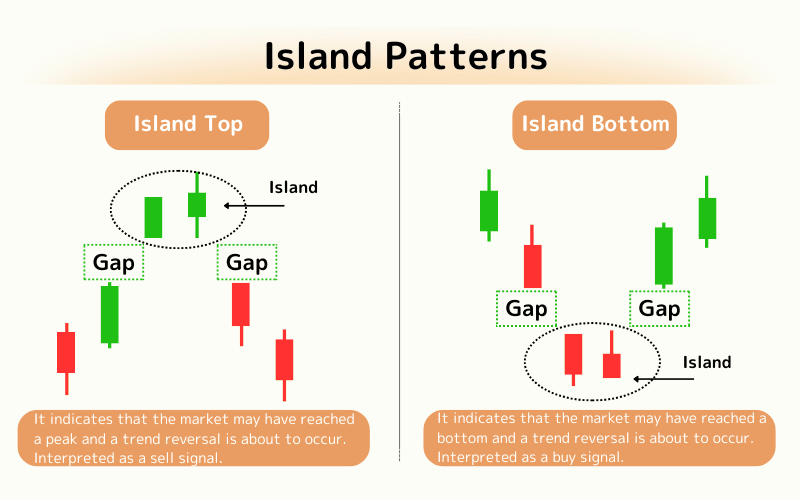
Island Reversal Top: Suggests that the market may have reached its peak and a trend reversal is imminent, often interpreted as a sell signal.
-
Island Reversal Bottom: Suggests that the market may have reached its bottom and a trend reversal is about to happen, often interpreted as a buy signal.
2. Island Reversal Top
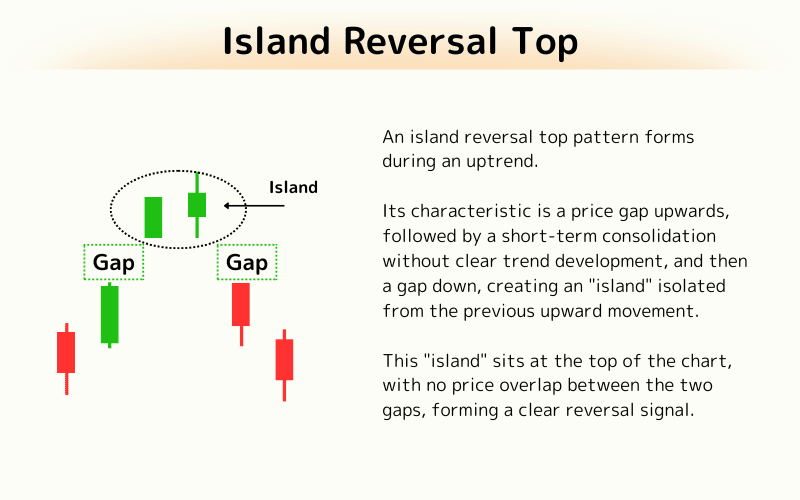
An island reversal top pattern forms during an uptrend.
Its characteristic is a price gap upwards, followed by a short-term consolidation without clear trend development, and then a gap down, creating an "island" isolated from the previous upward movement.
This "island" sits at the top of the chart, with no price overlap between the two gaps, forming a clear reversal signal.
Trading Strategy
After identifying the island reversal top pattern, traders can use it as a warning of an upcoming downtrend.
The strategy would be to consider selling or going short once the second gap down is formed and the price stabilizes below the "island."
A stop-loss point can be set above the price range of the "island" to manage risk.
When this pattern appears, especially with significant volume changes, it further strengthens the expectation of a downtrend. Therefore, traders should closely monitor subsequent price action and adjust their strategies to respond to potential market reversals.
3. Island Reversal Bottom
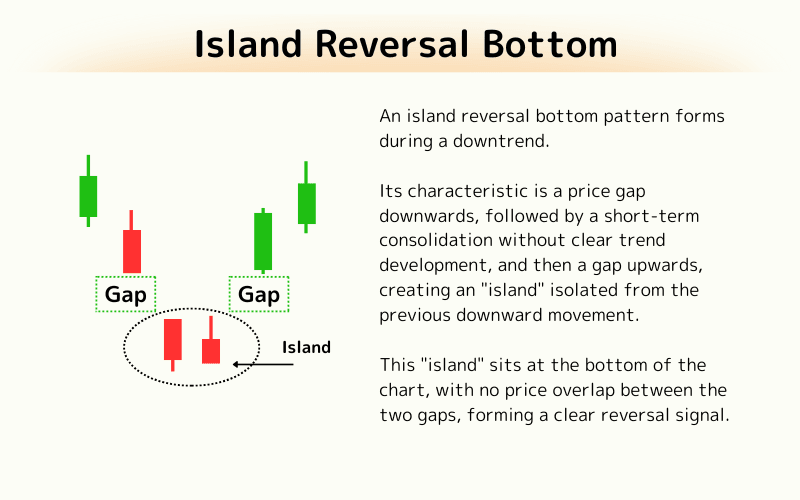
An island reversal bottom pattern forms during a downtrend.
Its characteristic is a price gap downwards, followed by a short-term consolidation without clear trend development, and then a gap upwards, creating an "island" isolated from the previous downward movement.
This "island" sits at the bottom of the chart, with no price overlap between the two gaps, forming a clear reversal signal.
Trading Strategy
After identifying the island reversal bottom pattern, traders can use it as a signal of an upcoming uptrend.
The strategy would be to consider buying or going long once the second gap up is formed and the price stabilizes above the "island."
A stop-loss point can be set below the price range of the "island" to manage risk.
When this pattern appears, especially with significant volume changes, it further strengthens the expectation of an uptrend. Therefore, traders should closely monitor subsequent price action and adjust their strategies to capitalize on potential market opportunities.
4. Frequently Asked Questions (FAQ)
Q1. What is an island reversal?
An isolated "island" of price between two gaps that strongly signals a trend reversal (§1).
Q2. How do the top and bottom differ?
A top forms at a peak and is a sell signal; a bottom forms at a low and is a buy signal (§2, §3).
Q3. What confirms the pattern?
The two gaps must leave no price overlap, so the "island" is clearly isolated (§1).
Q4. When should I enter?
Generally after the second gap forms and price stabilises outside the "island" (§2, §3).
Q5. How can I avoid false signals?
Confirm a volume spike and place stops outside the island's price range (§2).
Further Reading
Titan FX Trading Strategy Lab. We produce educational content for investors across forex, precious metals, energy, indices, US stocks, and crypto, covering technical analysis and how markets work.
Primary Sources (by Category)
- Educational & research: Investopedia, CMT Association
- Market & data: Bloomberg, Reuters, and TradingView chart analysis and commentary