

Three Gaps Pattern: Upward and Downward Three Gaps
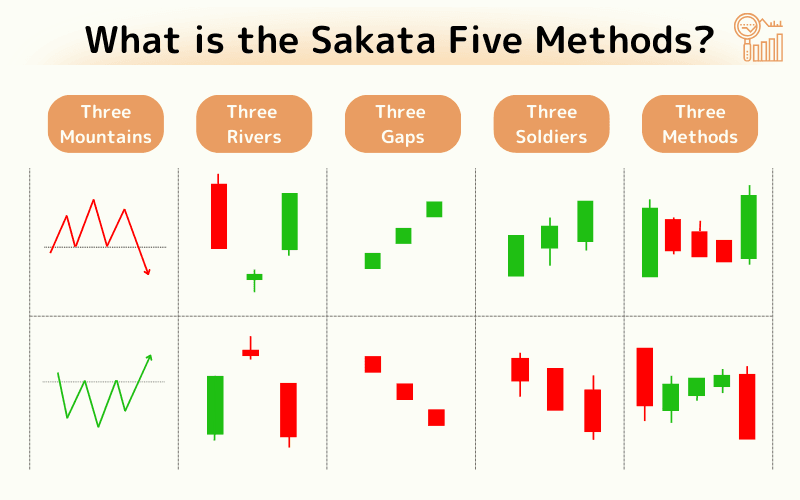
Handed down in Japan since the Edo period, the "Sakata Five Methods" is a rich framework of technical analysis that reads market psychology from the arrangement of candlesticks. Among them, the Three Gaps pattern is known for flagging when a move has gone too far and a reversal may be near.
This article explains the features of Upward and Downward Three Gaps, how to identify them, and the trading strategies and cautions involved — with charts.
- What it is: A Sakata pattern — three gaps in the same direction in a row
- Upward Three Gaps: Three rising gaps; overbought, watch for a downturn
- Downward Three Gaps: Three falling gaps; oversold, watch for a rebound
- How to identify: Trend context, gap location and size, the candles that follow
- Trading cautions: Wait for confirmation, set a stop-loss, and define a target
1. Upward Three Gaps
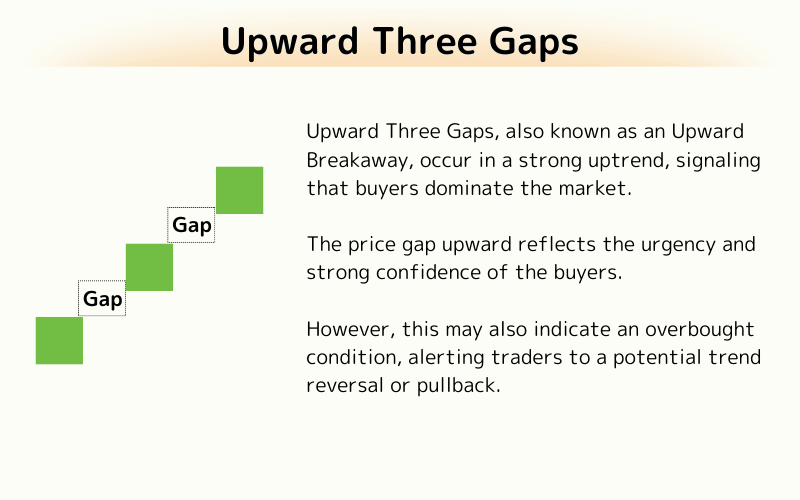
Upward Three Gaps, also known as an Upward Breakaway, occur in a strong uptrend, signaling that buyers dominate the market.
The price gap upward reflects the urgency and strong confidence of the buyers.
However, this may also indicate an overbought condition, alerting traders to a potential trend reversal or pullback.
2. Downward Three Gaps
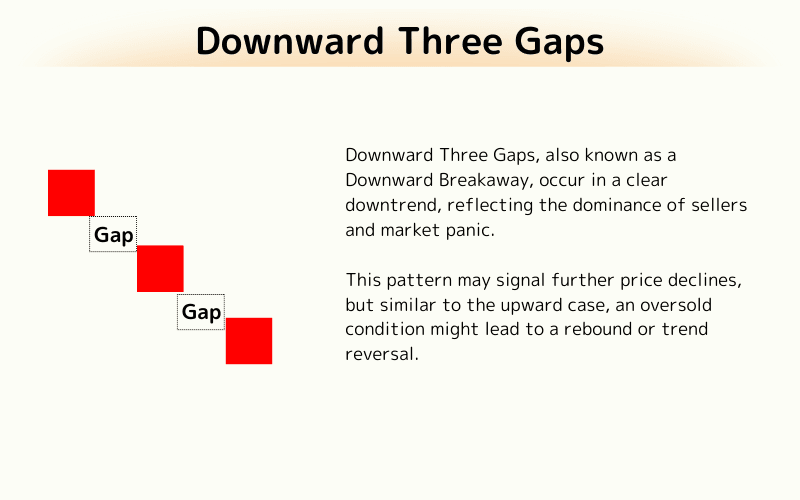
Downward Three Gaps, also known as a Downward Breakaway, occur in a clear downtrend, reflecting the dominance of sellers and market panic.
This pattern may signal further price declines, but similar to the upward case, an oversold condition might lead to a rebound or trend reversal.
3. Key Elements to Identify the Three Gaps Pattern
Identifying the Three Gaps pattern requires more than just focusing on the price gaps; traders should also consider the following elements:
1. Trend Background
The appearance of the Three Gaps pattern should align with the current market trend.
Upward Three Gaps appear in an uptrend, and Downward Three Gaps appear in a downtrend.
2. Price Gaps
Focus on the position and size of the gaps, as they should be clearly identifiable, showing strong market reactions at those points.
3. Subsequent Candlestick Patterns
Particularly after the third gap, the candlestick should confirm that the market continues to follow the trend direction prior to the gap.
4. Trading Strategies and Considerations for the Three Gaps Pattern
When trading using the Three Gaps pattern, traders should follow a series of strategies to optimize entry and exit points:
1. Wait for Confirmation
Before considering a trade based on the Three Gaps pattern, it is crucial to wait for the pattern to complete and receive confirmation. This means observing the three gaps and focusing on the subsequent candlestick patterns.
2. Risk Management
Set stop-loss levels, particularly around the third gap, to control potential losses if the market reverses unexpectedly.
3. Profit Target
Set reasonable profit targets based on the strength of the trend prior to the appearance of the Three Gaps pattern and the size of the gaps, ensuring profits can be locked in after the market reacts.
5. Frequently Asked Questions (FAQ)
Q1. How is Three Gaps related to the Sakata Five Methods?
Three Gaps is one of the "Sakata Five Methods" (Three Mountains, Three Rivers, Three Gaps, Three Soldiers, Three Methods), attributed to the Edo-era trader Munehisa Homma. It reads overheating and reversals from a run of consecutive gaps.
Q2. Does a Three Gaps pattern always lead to a reversal?
Not always. It is a signal of overbought or oversold conditions that raises the odds of a turn, but a strong trend can keep gapping further. Confirm with the following candles and volume.
Q3. Which timeframes work best for Three Gaps?
It works best on the daily chart and other timeframes where gaps are clearly visible, such as weekly or 4-hour. On very short timeframes gaps are rare, so reliability drops — check across multiple timeframes.
Q4. What should I watch out for when using Three Gaps?
Don’t rush into a counter-trade the moment three gaps appear: wait for a confirming candle, always set a stop-loss, and size your profit target to the strength of the preceding trend.
Further Reading
Titan FX Trade Strategy Research Lab covers forex (FX), commodities (oil, precious metals, agricultural products), stock indices, U.S. equities, and crypto assets — producing educational content for retail investors across asset classes.
Primary Sources (by Category)
- Reference: Investopedia — Gap
- Foundational works: Steve Nison, Japanese Candlestick Charting Techniques