Three Mountains: Triple Top and Bottom Reversal Patterns

The "Three Mountains" is a reversal pattern from Japan's Sakata methods that forms three peaks near a market top; when the middle peak is highest it is the "Three Buddhas" (head and shoulders), and a break of the neckline confirms the trend reversal.
The "Three Mountains" pattern is a crucial component of the "Five Methods of Sakata", a traditional Japanese technical analysis method. Its origins can be traced back to the rice trading markets of the 18th century. Developed by trading masters such as Homma Sōkyū, this method is still widely used today by traders worldwide to understand and predict market trends.
Among the key elements of Sakata’s Five Methods, "Three Mountains" is particularly important for identifying potential trend reversals at market tops and bottoms.
In this article, we will delve into the definition, significance, and application of the Three Mountains pattern in modern financial markets.
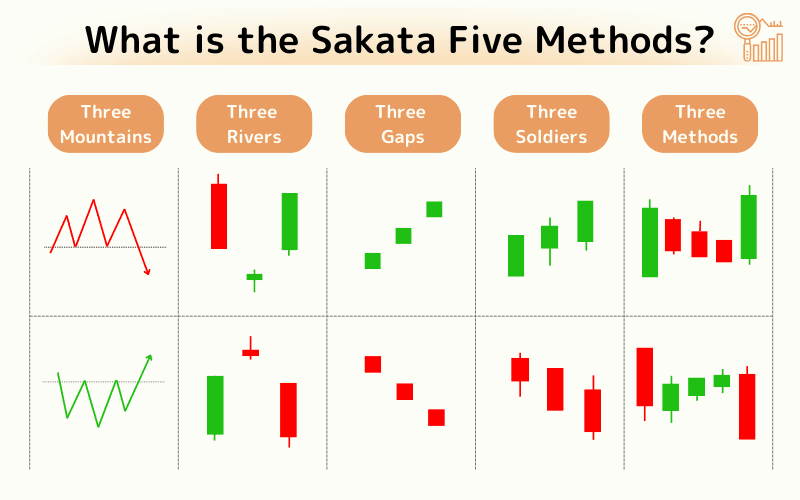
- Three Mountains is a Sakata reversal pattern with three peaks near a market top
- When the middle peak is highest it is the "Three Buddhas" (head and shoulders top)
- The inverted form, the triple bottom, signals a bullish reversal at a low
- A break of the neckline is the key confirmation of the trend change
- Wait for completion and the neckline break; beware false signals and big-player moves
1. Three Mountains: The Basics
"Three Mountains" refers to a candlestick chart pattern commonly seen during major trend reversals at market tops or bottoms. The most notable forms of this pattern include "Triple Top" (Three Peaks), "Triple Bottom" (Inverse Three Peaks), and "Three Mountains."
Triple Top occurs at the peak of an uptrend and is marked by three similar price highs, after which the trend reverses to the downside.
The term "Triple Top" is also known as "Head and Shoulders Top" in international markets, which signals a significant trend reversal.
If the middle peak is not the highest point, it is referred to as the "Three Mountains."
Conversely, the Triple Bottom (Inverse Three Peaks) represents a major reversal at the bottom of a downtrend, also known as the "Head and Shoulders Bottom" pattern.
2. How to Draw and Identify Triple Tops and Triple Bottoms
Triple Top and Triple Bottom are common reversal patterns in candlestick charts. They form when the price reaches similar levels three times, with a certain distance between each high or low, indicating consolidation after each peak or trough.
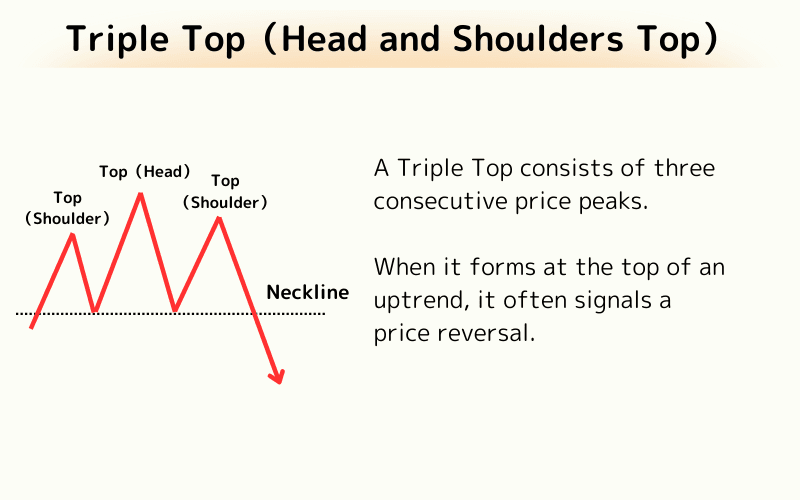
Triple Top (Head and Shoulders Top)
A Triple Top consists of three consecutive price peaks, and when it forms at the top of an uptrend, it often signals a price reversal.
Triple Bottom (Head and Shoulders Bottom)
A Triple Bottom pattern consists of three consecutive price lows, signaling a potential upward trend reversal when it forms at the bottom of a downtrend.
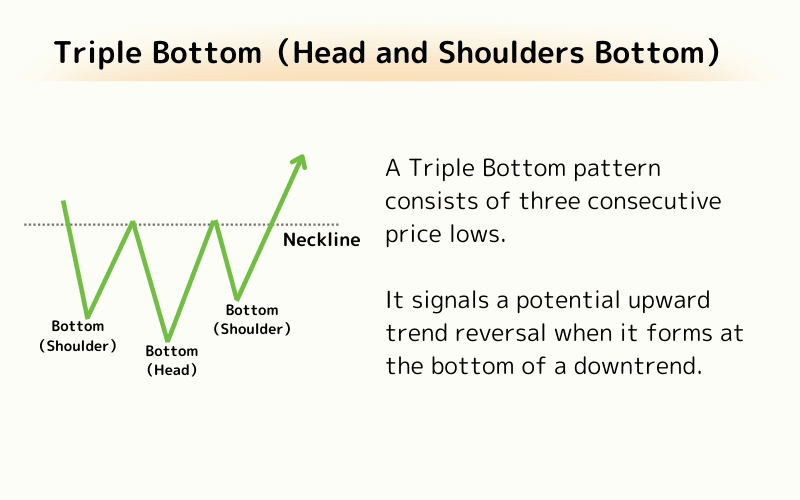
Neckline Drawing Method
The Neckline is a crucial concept in technical analysis for identifying specific chart patterns (such as Head and Shoulders). The neckline is drawn by connecting the key points in the pattern—either the low points for Triple Top or the high points for Triple Bottom—and extending the line to confirm the pattern and predict the future trend.
3. Features of Triple Top and Triple Bottom
Both the Triple Top and Triple Bottom are common chart patterns that indicate market uncertainty after reaching a specific price level. These patterns signal potential trend reversals through their structure.
Below are some common features of these patterns in stock trading:
| Features | Triple Top | Triple Bottom |
|---|---|---|
| Interval and Time | The distance and time between the peaks do not need to be equal. | The distance and time between the troughs do not need to be equal. |
| Price Similarity | The three peaks are generally close in price but do not need to be identical. | The three troughs are generally close in price but do not need to be identical. |
| Volume | The third peak often forms with lower volume, indicating a weakening of buying pressure. If the price breaks the neckline with increased volume, it confirms the downward trend. | The third trough forms, followed by rising prices and increased volume, indicating reduced selling pressure and the dominance of buying. A break of the neckline with increased volume confirms the upward trend. |
4. Points to Keep in Mind for Triple Top and Triple Bottom
It’s essential for investors to exercise caution until the Triple Top or Triple Bottom pattern has been fully formed and the price has clearly broken through the neckline. Here’s why:
1. Reversal Signal Is Not Fully Confirmed
The reversal signal is not fully confirmed until the price breaks through the neckline. Prior to this, the market may still be in a state of uncertainty, and the expected trend reversal has not yet been validated by the market.
2. Market Manipulation
Before confirming the pattern, market leaders and traders may still be adjusting their positions. They might not have fully sold off most of their stocks (in the case of Triple Top), or may not have bought enough stock (in the case of Triple Bottom), hoping for further price consolidation to achieve the best positioning.
3. Buying or Selling Timing
Only after the Triple Top or Triple Bottom pattern has fully formed and the price has broken the neckline should traders act. The break of the neckline is a clear market signal, indicating that the trend has reversed and offering a more reliable basis for making trading decisions.
5. Frequently Asked Questions (FAQ)
Q1. How do Three Mountains and the Three Buddhas differ?
"Three Mountains" is the general term for three peaks at a top; when the middle peak is highest, that specific shape is the "Three Buddhas," or head and shoulders (§1).
Q2. What is the inverted Three Mountains?
Three troughs at a bottom with the middle lowest, signalling a reversal to the upside (§1, §2).
Q3. How do I draw the neckline?
Connect the troughs between peaks (for a triple top) or the peaks between troughs (for a triple bottom) and extend the line (§2).
Q4. When should I enter?
Generally after the pattern completes and price clearly breaks the neckline (§4).
Q5. How can I avoid false signals?
Confirm the break with rising volume and avoid trading before the neckline is broken (§3, §4).
Further Reading
Titan FX Trading Strategy Lab. We produce educational content for investors across forex, precious metals, energy, indices, US stocks, and crypto, covering technical analysis and how markets work.
Primary Sources (by Category)
- Educational & research: Investopedia, CMT Association
- Market & data: Bloomberg, Reuters, and TradingView chart analysis and commentary