Top Reversal Candlestick Patterns in Forex and Stock Trading
Topping (bearish reversal) candlestick patterns appear at the peak of an uptrend and warn of a turn lower; key examples are the bearish engulfing, dark cloud cover, shooting star, and evening star.
Near the end of an uptrend, buying pressure tends to quietly run dry — and top reversal candlestick patterns are the first visible footprints of that shift in control, giving traders a chance to protect profits before the reversal arrives.
These key patterns are not only direct reflections of market dynamics but also tools for traders to manage risk and capture reversal opportunities.
This article provides a detailed analysis of four widely recognized top reversal candlestick patterns in forex and stock markets. By understanding these patterns, traders can navigate the market effectively and avoid costly mistakes at critical moments.
- Topping patterns appear at the peak of an uptrend and warn of a reversal
- The four key ones: bearish engulfing, dark cloud cover, shooting star, evening star
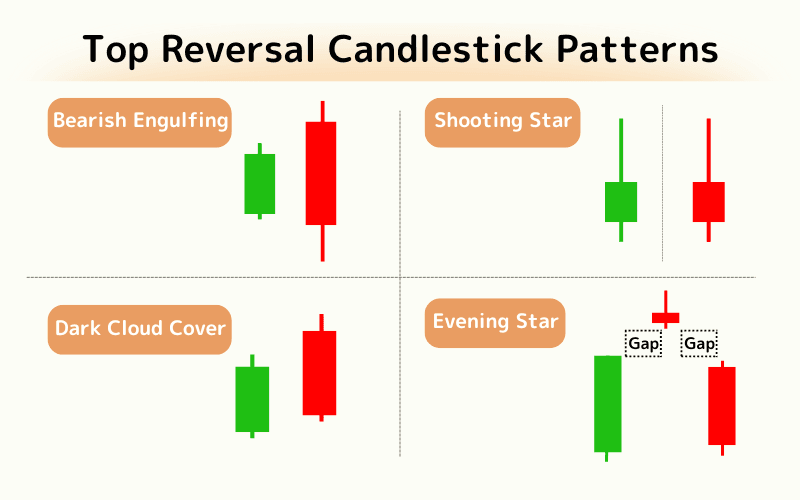
- Bearish engulfing: a large down candle engulfs the prior up candle
- Shooting star and evening star show buyers losing momentum
- Confirm with volume and the broader trend, not in isolation
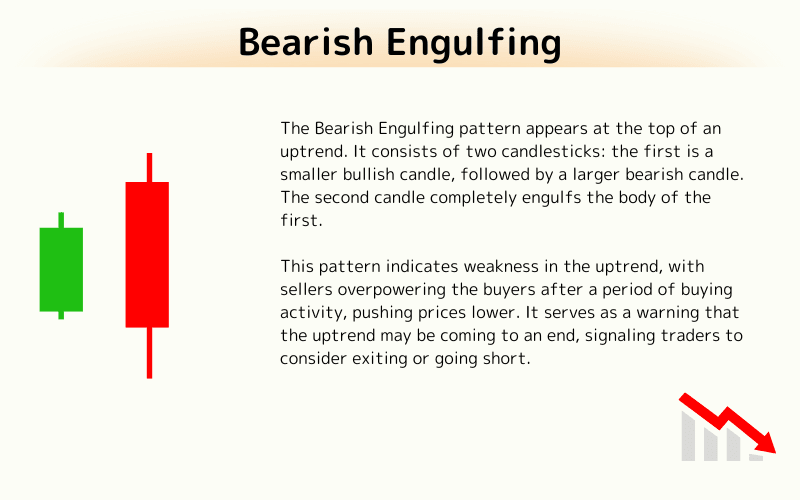
1. Bearish Engulfing
The Bearish Engulfing pattern appears at the top of an uptrend. It consists of two candlesticks: the first is a smaller bullish candle, followed by a larger bearish candle. The second candle completely engulfs the body of the first.
This pattern indicates weakness in the uptrend, with sellers overpowering the buyers after a period of buying activity, pushing prices lower. It serves as a warning that the uptrend may be coming to an end, signaling traders to consider exiting or going short.
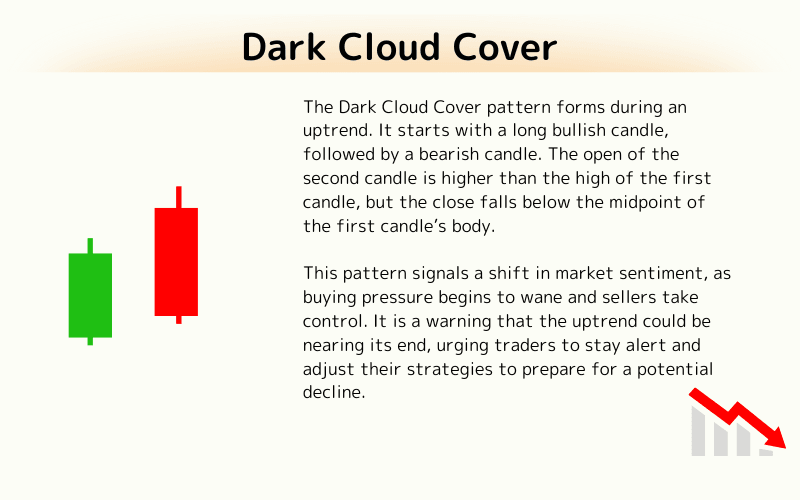
2. Dark Cloud Cover
The Dark Cloud Cover pattern forms during an uptrend. It starts with a long bullish candle, followed by a bearish candle. The open of the second candle is higher than the high of the first candle, but the close falls below the midpoint of the first candle’s body.
This pattern signals a shift in market sentiment, as buying pressure begins to wane and sellers take control. It is a warning that the uptrend could be nearing its end, urging traders to stay alert and adjust their strategies to prepare for a potential decline.
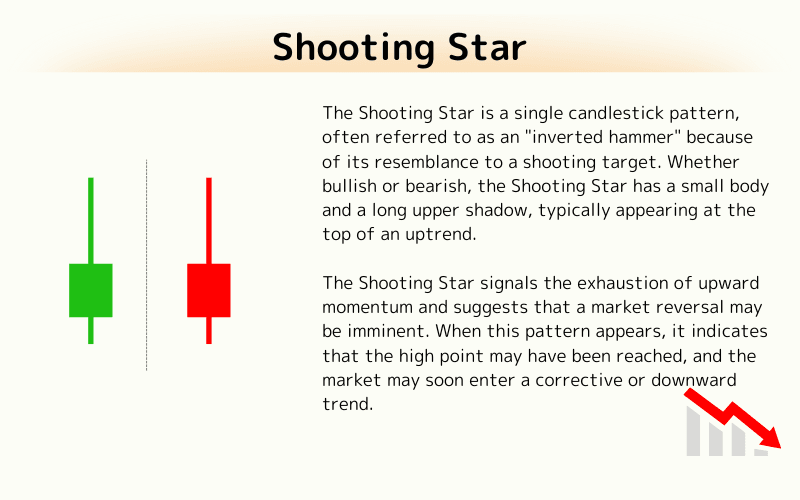
3. Shooting Star
The Shooting Star is a single candlestick pattern, often referred to as an "inverted hammer" because of its resemblance to a shooting target. Whether bullish or bearish, the Shooting Star has a small body and a long upper shadow, typically appearing at the top of an uptrend.
The Shooting Star signals the exhaustion of upward momentum and suggests that a market reversal may be imminent. When this pattern appears, it indicates that the high point may have been reached, and the market may soon enter a corrective or downward trend. Traders should be cautious and consider defensive actions.
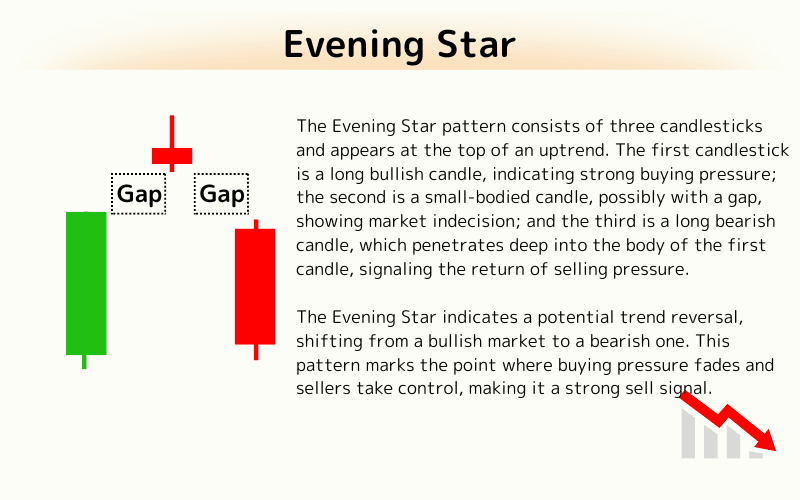
4. Evening Star
The Evening Star pattern consists of three candlesticks and appears at the top of an uptrend. The first candlestick is a long bullish candle, indicating strong buying pressure; the second is a small-bodied candle, possibly with a gap, showing market indecision; and the third is a long bearish candle, which penetrates deep into the body of the first candle, signaling the return of selling pressure.
The Evening Star indicates a potential trend reversal, shifting from a bullish market to a bearish one. This pattern marks the point where buying pressure fades and sellers take control, making it a strong sell signal. Traders should be aware that the market may soon enter a downtrend.
5. Frequently Asked Questions (FAQ)
Q1. What are topping candlestick patterns?
Candlestick patterns that form at the top of an uptrend and warn of a reversal lower (§1).
Q2. What are the main patterns?
The bearish engulfing, dark cloud cover, shooting star, and evening star (§1, §4).
Q3. How do I read a bearish engulfing?
A large down candle fully engulfs the prior up candle, a strong sell-side reversal signal (§1).
Q4. How do I avoid false signals?
Confirm with rising volume, the next candle, and alignment with the broader trend (§3).
Q5. Where do I enter and place stops?
Enter on the break after the pattern completes and place stops above the recent high (§4).
Further Reading
- Bottom Candlestick Patterns
- Reversal Patterns
- Three Soldiers and Crows
- Three Mountains
- Candlestick Charts
Titan FX Trading Strategy Lab. We produce educational content for investors across forex, precious metals, energy, indices, US stocks, and crypto, covering technical analysis and how markets work.
Primary Sources (by Category)
- Educational & research: Investopedia, CMT Association
- Market & data: Bloomberg, Reuters, and TradingView chart analysis and commentary