Triangle Patterns: Features, Analysis Methods,and Strategies
Triangle patterns are consolidation patterns drawn by two converging trendlines, in ascending, descending and symmetrical forms; price tends to trend in the direction of the eventual breakout.
Across forex, stocks, and other markets, triangle patterns are among the first chart formations traders learn — and the ones they put to use most often — in technical analysis.
A triangle pattern is formed by drawing two converging trendlines during a temporary price consolidation period.
This pattern reflects the balance between buying and selling forces in the market and signals an impending price breakout.
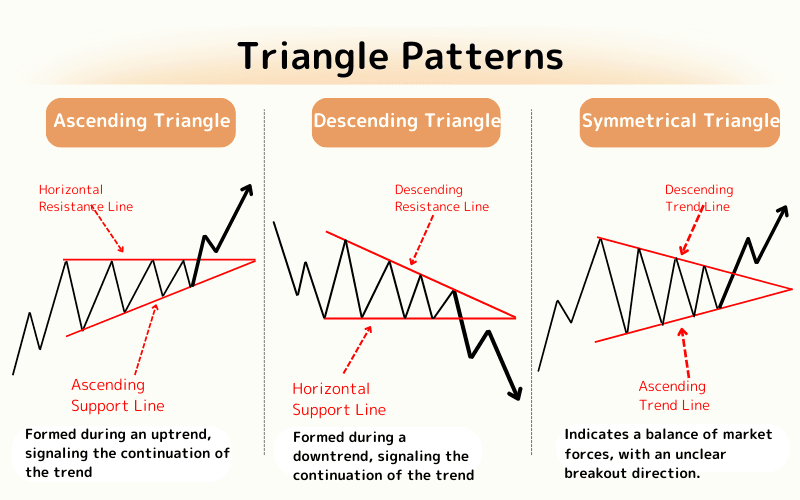
Triangle patterns can be divided into three types: Ascending Triangle, Descending Triangle, and Symmetrical Triangle. Each type has its own specific market meaning and trading signals.
In this article, we will explore these triangle patterns in depth, including their formation conditions, identification methods, and how to apply these patterns in real trading to develop strategies.
- A triangle is a consolidation drawn by two converging trendlines
- Ascending: horizontal resistance + rising lows, a break up continues the uptrend
- Descending: horizontal support + falling highs, a break down continues the downtrend
- Symmetrical: direction undecided; price trends in the breakout direction
- Confirm with volume on the break; target equals the triangle's height
1. Ascending Triangle Pattern
The Ascending Triangle is a chart pattern commonly seen in technical analysis, often regarded as a strong signal of a continuing uptrend.
This pattern appears particularly in an uptrend and is formed by connecting a series of progressively higher lows and a horizontal resistance line.
Features
Horizontal Resistance Line:
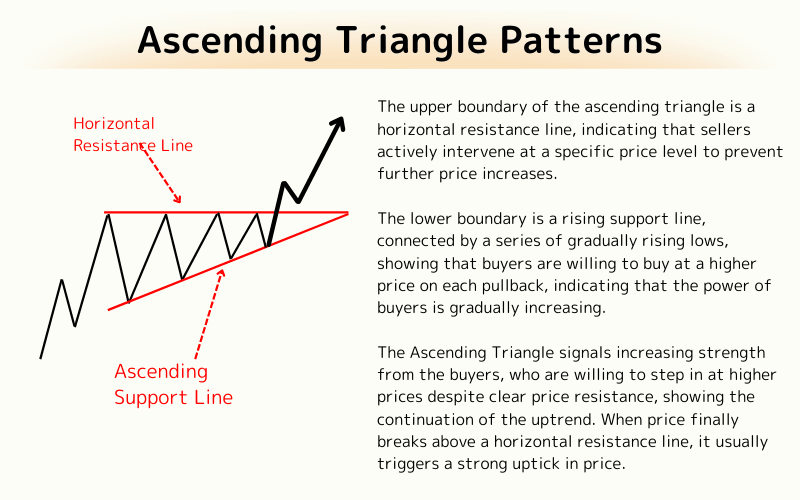
The upper boundary of the Ascending Triangle is a horizontal resistance line, indicating that sellers are actively intervening at a specific price level to prevent further price increases.
Ascending Support Line:
The lower boundary is an ascending support line, formed by connecting a series of progressively higher lows. This shows that buyers are willing to enter the market at higher prices with each pullback, indicating increasing buying strength.
Market Meaning
The Ascending Triangle signals increasing buying strength. Despite clear price resistance, buyers are willing to enter the market at higher levels, indicating the continuation of the uptrend.
When the price eventually breaks through the horizontal resistance line, it often triggers a strong upward move.
Trading Strategy
Entry at Breakout:
Traders typically enter the market when the price breaks through the resistance line with accompanying volume, anticipating the trend will continue.
Stop Loss:
The stop loss is usually placed below the most recent low or the ascending support line to protect the trade from small pullbacks.
Target Price:
The target price can be estimated by measuring the height of the triangle's opening and projecting that height upward from the breakout point.
2. Descending Triangle Pattern
The Descending Triangle Pattern forms in a downtrend, created by a horizontal support line and a series of progressively lower highs connected by a descending trendline.
Features
Horizontal Support Line:
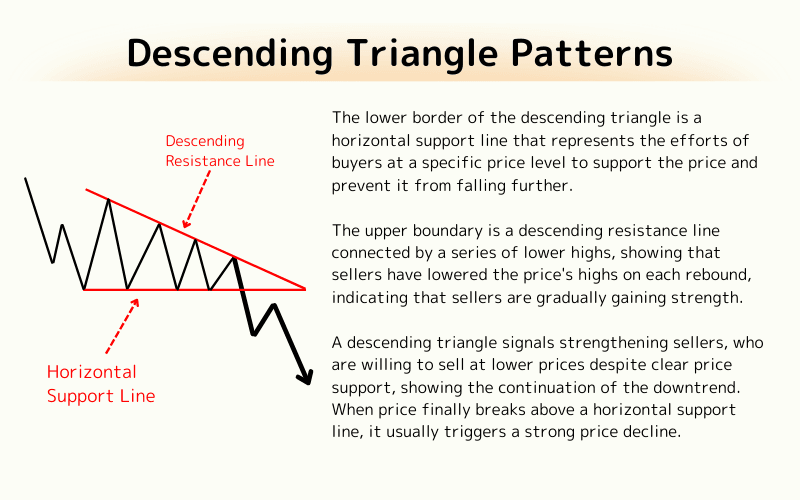
The lower boundary of the Descending Triangle is a horizontal support line, indicating that buyers are trying to support the price at a specific level to prevent further declines.
Descending Resistance Line:
The upper boundary is a descending resistance line, formed by connecting a series of lower highs. This shows that sellers are applying pressure at each rally, indicating increasing selling strength.
Market Meaning
The Descending Triangle signals increasing selling strength. Despite clear price support, sellers are willing to sell at lower prices, indicating the continuation of the downtrend.
When the price eventually breaks through the horizontal support line, it often triggers a strong downward move.
Trading Strategy
Entry at Breakout:
Traders typically enter the market when the price breaks through the support line with corresponding volume, anticipating the trend will continue.
Stop Loss:
The stop loss is usually placed above the most recent high or the descending trendline to protect the trade from small rallies.
Target Price:
The target price can be estimated by measuring the height of the triangle's opening and projecting that height downward from the breakout point.
3. Symmetrical Triangle Pattern
The Symmetrical Triangle Pattern can appear in various markets and across multiple timeframes, often signaling that a directional breakout is imminent.
This pattern is formed by two converging trendlines: a descending trendline from the highs and an ascending trendline from the lows, with both trendlines converging at approximately the same angle, forming a symmetrical triangle.
Features
Converging Trendlines:
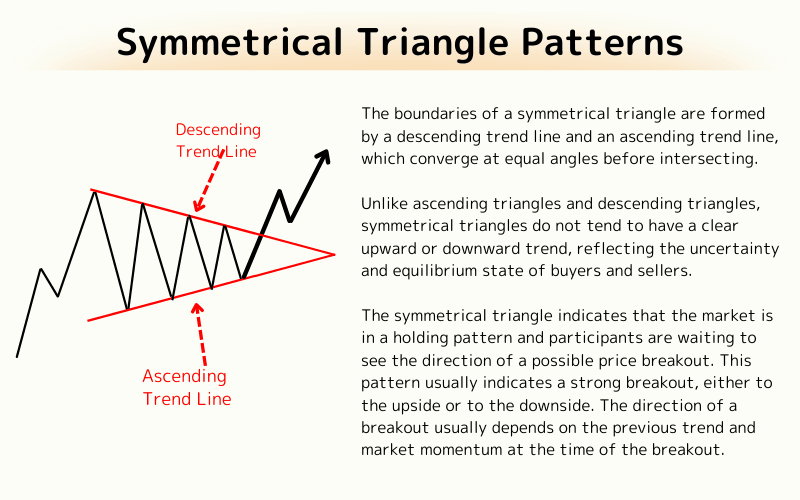
The boundaries of the Symmetrical Triangle are formed by a descending trendline and an ascending trendline, which converge at an equal angle before intersecting.
Indecisive Direction:
Unlike the Ascending and Descending Triangles, the Symmetrical Triangle does not indicate a clear uptrend or downtrend. It reflects a state of uncertainty and equilibrium between buyers and sellers.
Market Meaning
The Symmetrical Triangle suggests that the market is in a waiting phase, with participants observing the potential direction of the price breakout. This pattern often signals a strong breakout, whether upward or downward.
The breakout direction is typically determined by the prior trend and the market momentum at the time of the breakout.
Trading Strategy
Entry at Breakout
Traders should closely monitor the breakout direction of the Symmetrical Triangle and enter the market once the breakout is confirmed and supported by corresponding volume. This indicates that the market has chosen a new direction.
Stop Loss
The stop loss is usually set inside the opposite boundary of the Symmetrical Triangle to protect the trade from potential price reversals.
Target Price
The target price can be estimated by measuring the height of the widest part of the triangle and projecting that height from the breakout point in the direction of the breakout.
4. Summary
To better understand the impact of triangle patterns on market trends, we summarize their features and market implications in the table below:
| Type | Boundaries | Market Expectation | Breakout Direction |
|---|---|---|---|
| Ascending Triangle | Horizontal resistance line and ascending support line | Signal of continued uptrend | Breakout to the upside |
| Descending Triangle | Horizontal support line and descending resistance line | Signal of continued downtrend | Breakout to the downside |
| Symmetrical Triangle | Descending trendline and ascending trendline | Indecisive market signal | Breakout in either direction |
5. Frequently Asked Questions (FAQ)
Q1. What is a triangle pattern?
A consolidation pattern drawn by two converging trendlines that precedes a breakout (§1).
Q2. How do the three types differ?
Ascending has horizontal resistance with rising lows, descending has horizontal support with falling highs, and symmetrical is direction-undecided (§1, §2, §3).
Q3. Where do I enter?
Typically when price breaks a boundary on rising volume (§1).
Q4. How is the target calculated?
Project the height of the triangle's widest part in the breakout direction (§3).
Q5. Where do I place stops?
Commonly at recent highs/lows or just outside the opposite boundary (§2).
Further Reading
Titan FX Trading Strategy Lab. We produce educational content for investors across forex, precious metals, energy, indices, US stocks, and crypto, covering technical analysis and how markets work.
Primary Sources (by Category)
- Educational & research: Investopedia, CMT Association
- Market & data: Bloomberg, Reuters, and TradingView chart analysis and commentary