Wedge Patterns Explained: Rising and Falling Wedge Features and Strategies

A wedge pattern is a consolidation in which price moves between two trendlines converging in the same direction, with momentum and volume typically fading. A rising wedge tends to signal a downside reversal and a falling wedge an upside reversal — but the actual direction is only confirmed once price clearly breaks a trendline on rising volume.
Wedge patterns are among the easiest to misread in technical analysis: they look as though the trend is still running, yet they often signal that momentum is quietly draining away — which is exactly why they deserve a trader's close attention.
This pattern shows a period of convergence, providing a clear signal of an upcoming trend change. Whether in stocks, forex, or commodities markets, wedge patterns are key indicators for predicting price breakouts.
This article explores the structure, types, and practical applications of wedge patterns, aiming to enhance the efficiency and accuracy of trading decisions.
- The wedge's structure: two same-direction converging trendlines with fading momentum
- Rising wedge reversal vs continuation types and what each breakout means
- Falling wedge reversal vs continuation types and what each breakout means
- Reading the breakout direction: trendlines, volume, and follow-through
- Trading essentials: wait for breakout confirmation, watch volume, set a stop-loss
1. What are Wedge Patterns?
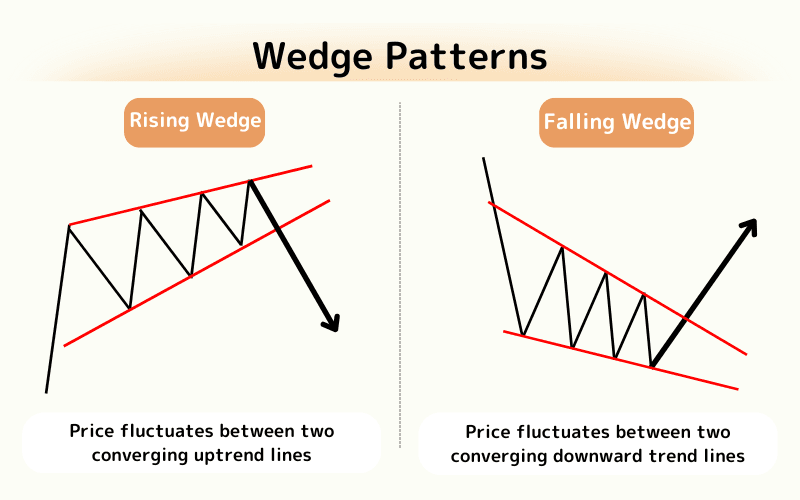
Wedge patterns (Wedge Patterns) describe price movements within two trendlines that converge in the same direction. These trendlines are drawn by connecting the highs and lows of the price action.
During this consolidation phase, price fluctuations often show weakening momentum, with trading volume typically decreasing as well.
This pattern is further divided into two types: Rising Wedge and Falling Wedge, each reflecting different market behavior at various stages of trend development.
2. Rising Wedge
The rising wedge can be classified into two types: trend reversal rising wedge and trend continuation rising wedge.
Trend Reversal Rising Wedge
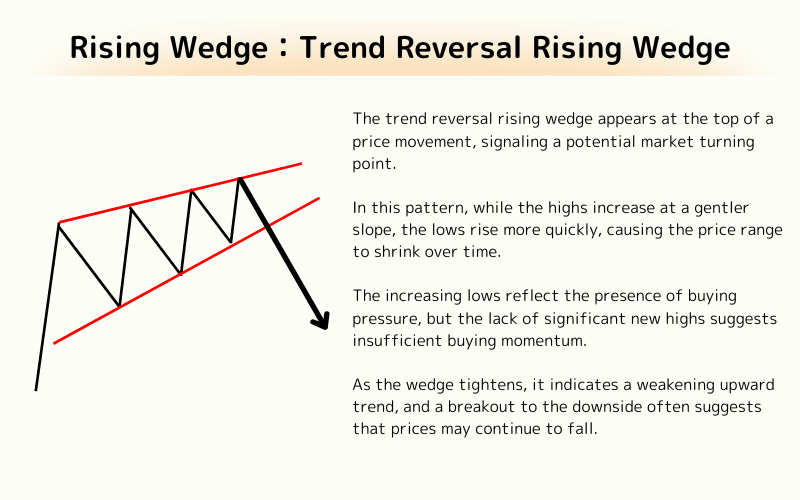
The trend reversal rising wedge appears at the top of a price movement, signaling a potential market turning point.
In this pattern, while the highs increase at a gentler slope, the lows rise more quickly, causing the price range to shrink over time.
The increasing lows reflect the presence of buying pressure, but the lack of significant new highs suggests insufficient buying momentum.
As the wedge tightens, it indicates a weakening upward trend, and a breakout to the downside often suggests that prices may continue to fall.
Trend Continuation Rising Wedge
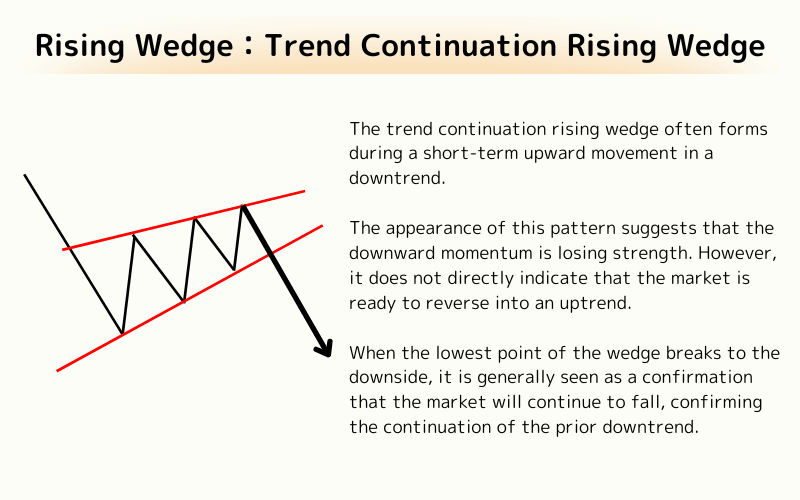
The trend continuation rising wedge often forms during a short-term upward movement in a downtrend.
The appearance of this pattern suggests that the downward momentum is losing strength. However, it does not directly indicate that the market is ready to reverse into an uptrend.
When the lowest point of the wedge breaks to the downside, it is generally seen as a confirmation that the market will continue to fall, confirming the continuation of the prior downtrend.
3. Falling Wedge
The falling wedge can also be classified into trend reversal and trend continuation types.
Trend Reversal Falling Wedge
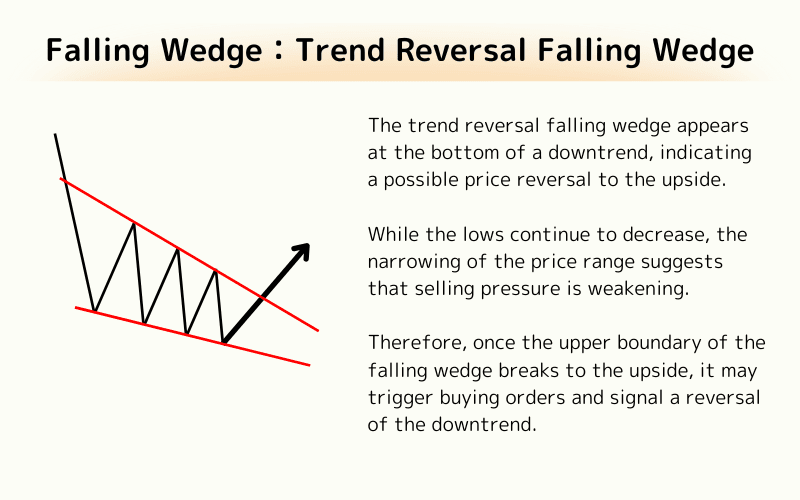
The trend reversal falling wedge appears at the bottom of a downtrend, indicating a possible price reversal to the upside.
While the lows continue to decrease, the narrowing of the price range suggests that selling pressure is weakening.
Therefore, once the upper boundary of the falling wedge breaks to the upside, it may trigger buying orders and signal a reversal of the downtrend.
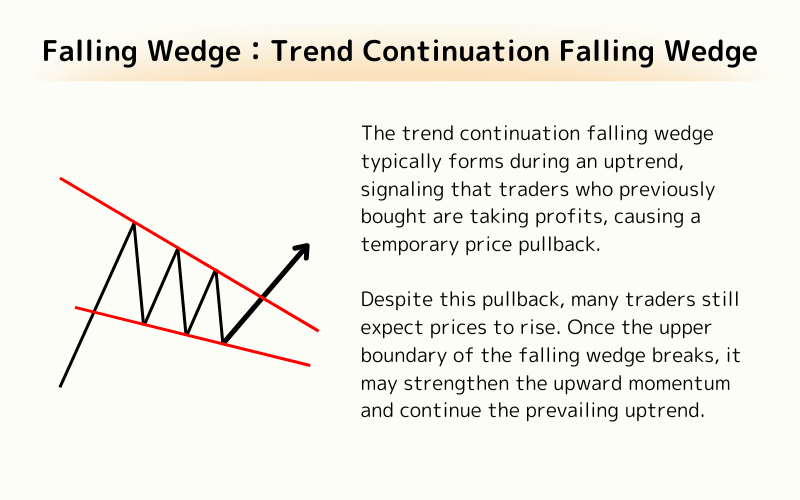
Trend Continuation Falling Wedge
The trend continuation falling wedge typically forms during an uptrend, signaling that traders who previously bought are taking profits, causing a temporary price pullback.
Despite this pullback, many traders still expect prices to rise. Once the upper boundary of the falling wedge breaks, it may strengthen the upward momentum and continue the prevailing uptrend.
4. Key Points to Consider When Trading with Wedge Patterns
When trading with wedge patterns, consider the following key points to improve your success rate and minimize potential risks:
1. Confirm the Breakout
The effectiveness of the wedge pattern often depends on whether the price can break out of the trendlines that form the pattern. Therefore, it’s crucial to wait for a clear breakout with adequate volume before considering a trade.
2. Watch for Volume Changes
Ideally, a breakout from a wedge pattern should be accompanied by an increase in volume. Increased volume provides additional confirmation that the market is supporting the breakout.
If the breakout occurs without sufficient volume, the reliability of the signal may decrease.
3. Set Stop-Loss Levels
Even the most accurate technical analysis cannot guarantee a 100% success rate. Therefore, setting stop-loss levels when executing any trade is essential. Determine a reasonable stop-loss position to limit losses if the wedge pattern reverses or the breakout fails.
5. Frequently Asked Questions (FAQ)
Q1: Does a rising wedge always fall and a falling wedge always rise?
Not necessarily. Wedges come in reversal and continuation types; the direction depends on where the pattern forms and the eventual breakout. Always confirm after price breaks the trendline.
Q2: How do I judge the breakout direction of a wedge?
Wait for price to clearly break the trendline on supporting volume. Rising wedges more often break down and falling wedges more often break up, but trade the actual breakout rather than anticipating it.
Q3: How is a wedge different from a triangle?
A triangle's two trendlines are usually one up and one down, or one flat; a wedge's lines both slope the same way (both up or both down) and typically come with fading momentum and volume.
Q4: How do I estimate a wedge's price target?
A common method is to measure the vertical height at the widest part of the wedge and project it from the breakout point — but treat it as a reference and pair it with a stop-loss and other indicators.
Q5: Are wedge patterns reliable?
Wedges are common and useful, but no pattern guarantees success. Always wait for breakout confirmation, watch volume, set a stop-loss, and combine them with other analysis.
Further Reading
- Triangle Patterns Explained
- Flag Patterns Explained
- What Are Reversal Patterns?
- What Is Technical Analysis?
Titan FX's financial-market research team. We cover a broad set of instruments — foreign exchange, commodities (crude oil, precious metals, agricultural products), equity indices, US equities, and digital assets — producing educational content for investors.
Primary Sources (by Category)
- Pattern definitions: Investopedia — Wedge, BabyPips — Chart Patterns
- Technical-analysis method: StockCharts — Chart Patterns