What are DMI and ADX? MT4/MT5 settings and usage

DMI is a technical indicator consisting of three lines: +DI, -DI, and ADX. It was developed to address the limitations of oscillators like RSI, which struggle to perform effectively in trending markets.
This article delves into the DMI and ADX technical indicators, including the calculation methods for +DI, -DI, and ADX, trend analysis techniques, divergence applications, and setup methods in MT4 and MT5. It aims to help investors accurately capture market trends and reversal opportunities.
What is DMI・ADX
What is DMI
DMI (Directional Movement Index) was designed by J.W. Wilder, who is also known for developing the RSI indicator. It was created to address the issue of oscillators like RSI failing to perform well in trending markets.
DMI consists of three lines: +DI, -DI, and ADX, used to analyze whether the market is in a trend and to measure the strength of that trend.
Main Components of DMI
| Indicator | Description |
|---|---|
| +DI | Represents the strength of upward movement |
| -DI | Represents the strength of downward movement |
| ADX | Measures the strength of the trend |
What is ADX
ADX (Average Directional Movement Index) is an indicator used to measure the strength of a market trend.Regardless of the market direction, when the trend momentum strengthens, ADX rises; conversely, when the trend is unclear or the momentum weakens, ADX decreases.
In MT4 (MetaTrader 4) and MT5 (MetaTrader 5), ADX is known as the "Average Directional Movement Index." ADX can be used not only in conjunction with the DMI indicator but also as a standalone technical analysis tool.
DMI・ADX Calculation Formula
Before calculating +DI and -DI, it is necessary to calculate +DM (upward movement) and -DM (downward movement).
The formulas for +DM and -DM are as follows:
- +DM: Current day's high - Previous day's high
- -DM: Previous day's low - Current day's low
These are the basic calculation formulas, but the following conditions apply:
| Condition | Description |
|---|---|
| Condition 1 | If +DM < 0, then +DM = 0. This means if the upward movement is negative, set +DM to 0. |
| Condition 2 | If -DM < 0, then -DM = 0. This means if the downward movement is negative, set -DM to 0. |
| Condition 3 | If +DM > -DM, then -DM = 0. This means if the upward movement is greater than the downward movement, set -DM to 0. |
| Condition 4 | If -DM > +DM, then +DM = 0. This means if the downward movement is greater than the upward movement, set +DM to 0. |
Next, calculate the maximum price range of the day, known as TR (True Range):
- A: Current day's high - Previous day's close
- B: Previous day's close - Current day's low
- C: Current day's high - Current day's low
TR is the maximum value from the above three options.
Then, calculate +DI and -DI:
- +DI = (Sum of +DM over N days ÷ Sum of TR over N days) × 100
- -DI = (Sum of -DM over N days ÷ Sum of TR over N days) × 100
Typically, the N period is set to 14 days, which is the default on platforms like MT4, MT5, and TradingView.
Finally, calculate ADX:
- DX = (|+DI - -DI|) ÷ (+DI + -DI) × 100
- ADX = N-day average of DX
Although the calculation formulas for DMI and ADX are somewhat complex, there’s no need to memorize the exact steps. Using these indicators is not difficult, which is one of their key features.
DMI・ADX Interpretation
Below we continue to explain how to interpret each line.
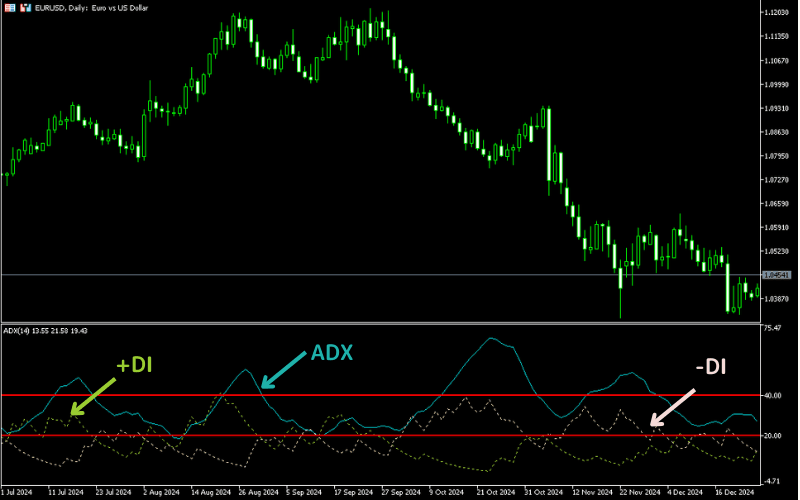
+DI Line
The +DI line is usually used to represent the strength of the upward trend.
In a downtrend, the +DI line typically stays below 20; when the price rebounds, the +DI line will rise.
In the chart below, we can see that the price continues to fall, and the +DI line remains at a low level.

-DI Line
The -DI line is usually used to represent the strength of the downward trend.
When the price drops, the -DI line rises; when the price rises, the -DI line falls.
When the -DI line exceeds the 20 to 30 range, the possibility of a downward trend increases.
ADX Line
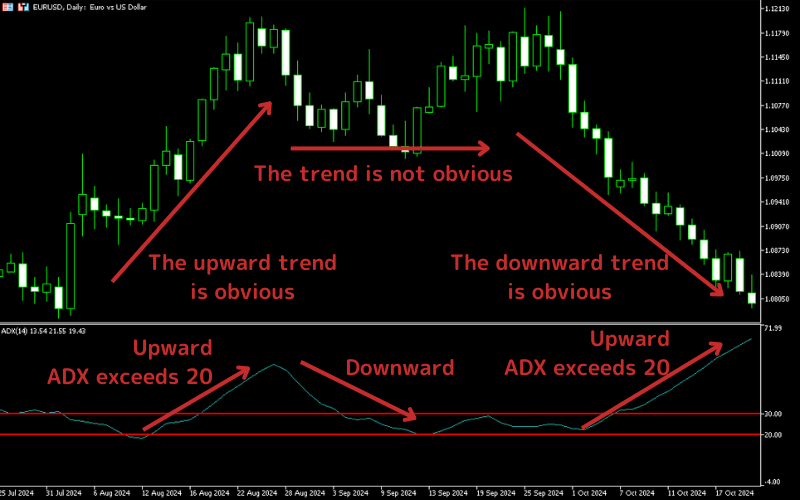
The ADX line is primarily used to measure the strength of the market trend.
Whether it’s an uptrend or downtrend, once a trend starts to form, the ADX line will rise, indicating market momentum.
When the ADX line crosses the 20 to 30 range, it means that the market trend has become stronger, and a stronger market move may follow.
However, when the market reverses or the trend is no longer clear, the ADX line value will gradually fall, showing that the market lacks a clear trend.
When using ADX, it’s important to be aware of the type of moving average used to calculate ADX.
Common types of moving averages include Simple Moving Average (SMA), Exponential Moving Average (EMA), and Smoothed Moving Average (RMA). Different trading platforms or chart tools may use different moving averages for ADX calculation.
For example, MT4 and MT5 platforms use the Exponential Moving Average (EMA).
While the differences between these moving averages are small, understanding the calculation method used by your tools can help interpret the changes in the ADX line more accurately.
How to Use DMI・ADX
When using DMI and ADX, focus on the following three points:
1: The Position of +DI and -DI
2: The Rise of ADX
3: Divergence Phenomenon
By observing these three factors, you can analyze whether the upward or downward trend is stronger, how the strength of the trend changes, and whether the trend might reverse.
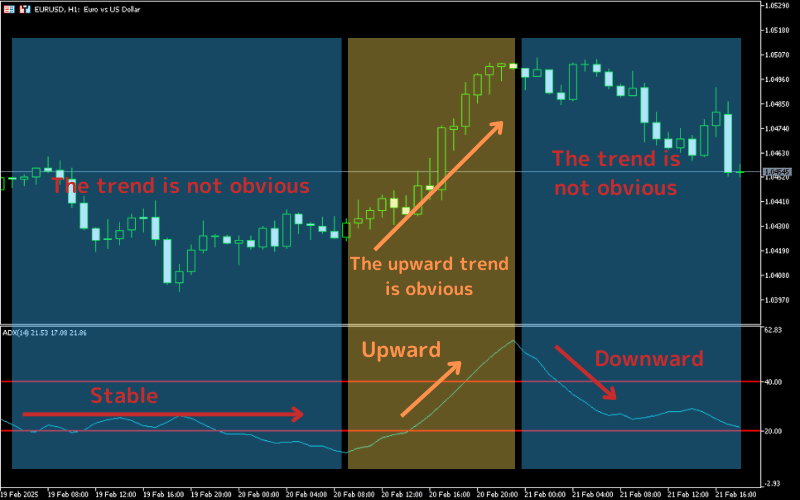
1. The Position of +DI and -DI
+DI represents the strength of the uptrend, and -DI represents the strength of the downtrend.
When +DI is above -DI, it indicates that the market is in an uptrend; conversely, when -DI is above +DI, it indicates that the market is in a downtrend.
If +DI and -DI cross, it means that the strength of the market’s movement is changing, and there could be a trend reversal.
For example, in the 1-hour chart of EUR/USD below, you can clearly see the changes in the position of +DI and -DI, reflecting the uptrend and downtrend of the market.
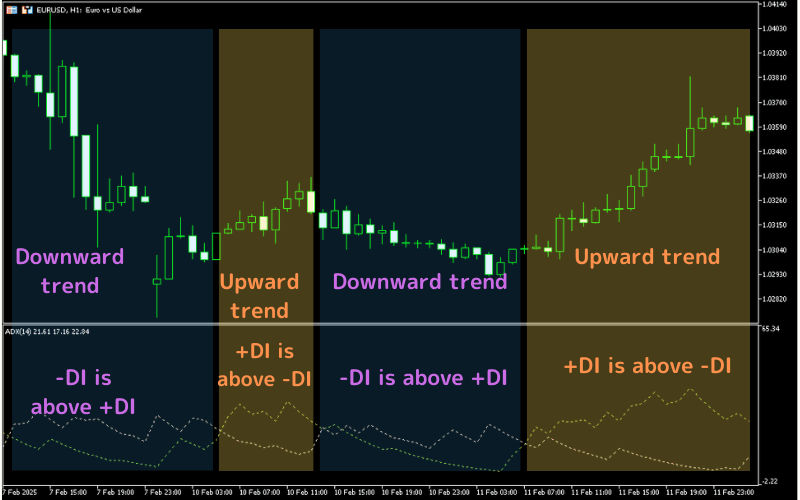
However, even in the same 1-hour chart, if the market lacks a clear direction, +DI and -DI might frequently cross each other, and extra caution is needed in such cases.
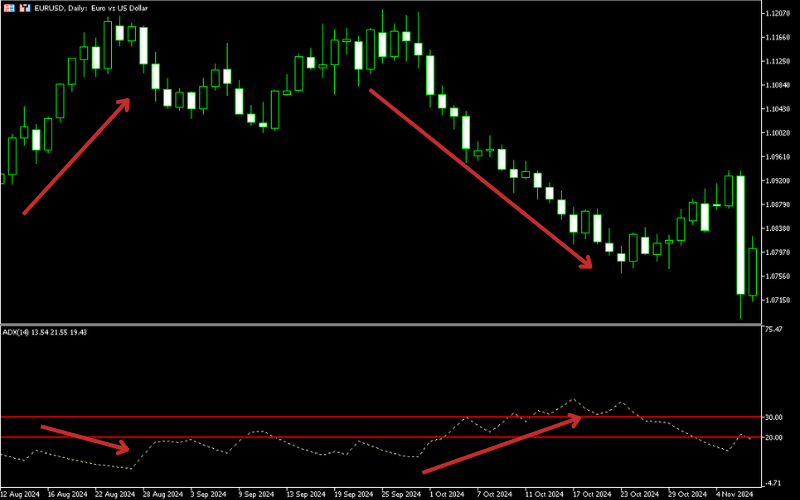
2. The Rise of ADX
As mentioned earlier, when ADX rises and breaks through the 20-30 range, it may indicate the beginning of a strong trend.
At this point, you should closely observe the trend's development in conjunction with the price movement.
3. Divergence Phenomenon
ADX reflects the strength of the trend, and +DI/-DI reflects the strength of the uptrend and downtrend.
Similar to RSI, you can analyze the divergence between ADX or +DI/-DI and the price to determine if the trend may be reaching a peak or bottom.
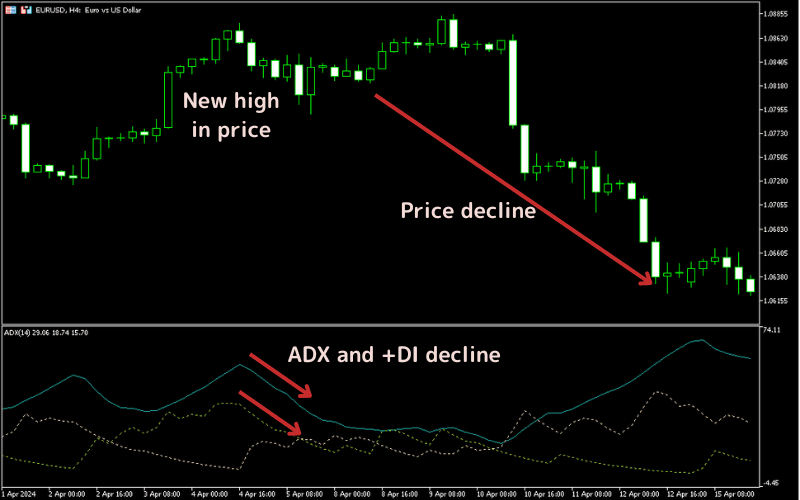
For example, in the 4-hour EUR/USD chart below, despite the price making a new high, +DI and ADX are declining, suggesting that even though the price is rising, the momentum of the uptrend is weakening, which may indicate that the uptrend is nearing its peak.
How to Plot DMI・ADX on MT4/MT5
You can plot the DMI・ADX indicators on the MT4 or MT5 trading platform by following these steps:
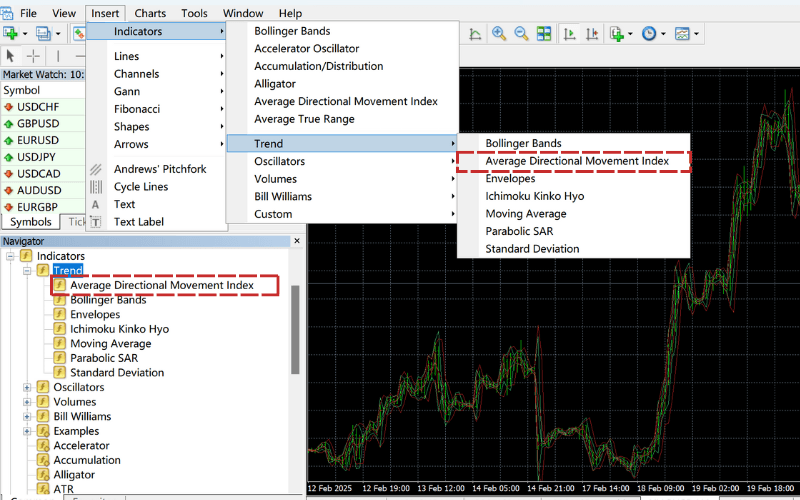
How to Plot DMI・ADX on MT4
① Log in to MT4
② Open the chart of the trading pair
③ Click on the "Insert" menu - "Indicators" - "Trend" - "Average Directional Movement Index"; or click on the "Navigator" panel - "Indicators" - "Trend" - "Average Directional Movement Index".
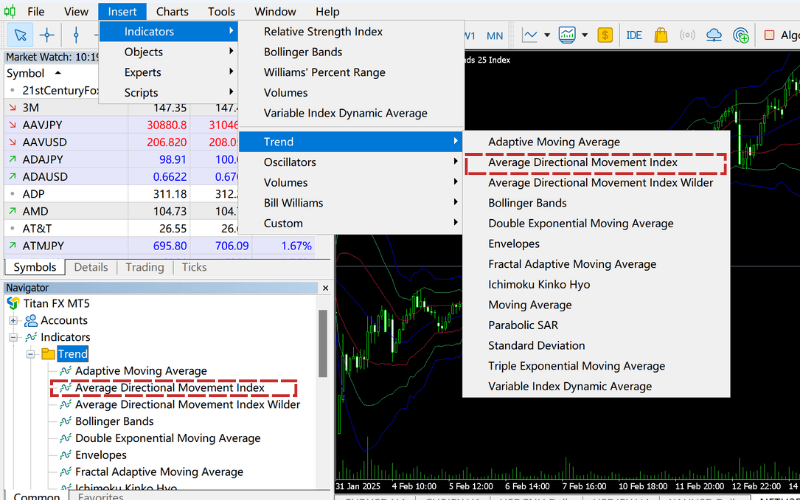
How to Plot DMI・ADX on MT5
① Log in to MT5
② Open the chart of the trading pair
③ Click on the "Insert" menu - "Indicators" - "Trend" - "Average Directional Movement Index"; or click on the "Navigator" panel - "Indicators" - "Trend" - "Average Directional Movement Index".
Frequently Asked Questions About DMI · ADX
Here are some common questions related to DMI · ADX:
Q1: What does DMI · ADX tell us?
DMI · ADX helps analyze whether the market is trending and understand the strength and direction of the trend.
Here's a table summarizing the key points:
| Indicator | Description |
|---|---|
| +DI Line | When the price rises, the +DI line typically rises, showing the strength of the uptrend. |
| -DI Line | When the price falls, the -DI line typically rises, showing the strength of the downtrend. |
| ADX Line | When the market trends, the ADX line will rise, indicating the trend’s formation. |
Q2: What is the best period to set for DMI · ADX?
According to the creator of DMI · ADX, J.W. Wilder, the recommended period is 14 days.
In MT4 and MT5, the default period is set to 14 days, so you typically don’t need to change the settings after adding the indicator to the chart.
Q3: How do I interpret the ADX line values?
The value of the ADX line helps us understand the trend strength in the market. Typically, the ADX value ranges from 0 to 100, with higher values indicating a stronger trend.
- 0-20: Shows that the market is in a range, with no clear trend.
- 20-25: Indicates that the market may begin to form a trend, but not strongly.
- 25-50: Indicates a strong market trend that may continue.
- 50-75: The trend is very strong, and the market is likely to follow the trend most of the time.
- 75-100: The market is in an extreme trend, often accompanied by large price fluctuations.
Q4: Should I avoid entering the market when ADX is below 20?
When ADX is below 20, it usually means the market is in a consolidation phase or the trend is weak. In such cases, trend-following trades may not be suitable because the market lacks a clear direction.
However, this doesn’t mean you should avoid entering the market entirely. For range-bound markets, traders can consider using other strategies to find opportunities.
When ADX is below 20 and the market is consolidating, traders should be cautious of false signals and act with care.
Summary
DMI (Directional Movement Index) is a technical analysis tool composed of three lines: +DI, -DI, and ADX, used to analyze the strength and direction of market trends.
+DI and -DI represent the strength of the uptrend and downtrend, respectively, while ADX measures the overall strength of the trend.
DMI indicators are particularly useful in trending markets, effectively addressing the limitations of other oscillators in such conditions.
By observing the changes in these indicators, traders can accurately analyze market conditions and make informed trading decisions.