Capital Reduction: Types, Impacts, and Strategies Unveiled
Capital reduction is a financial action in which a company lowers its registered capital by cutting outstanding shares to reshape its capital structure — used to manage excess cash, offset accumulated losses, or support a lagging share price.
Capital reduction is one of the most debated tools in corporate finance. Often used to manage excess cash, offset losses, or boost a lagging stock price, it can signal opportunity or risk. From Yageo's legendary turnaround to cases exposing corporate struggles, capital reduction is a double-edged sword.
This article dives into its types, process, effects, and stock price calculations, with real-world examples and tips to help investors grasp its true implications.
- Core idea: cutting registered capital and shares to reshape the capital structure
- Two types: nominal (offset losses) vs real (return cash to shareholders)
- Price impact: per-share price is revised up after ex-rights; total value unchanged in theory
- Bullish or bearish: depends on the motive and fundamentals, not the reduction itself
- For investors: identify the type and purpose; don't panic or chase on the word alone
1. What Is Capital Reduction?
Definition
Capital reduction involves a company lowering its registered capital by decreasing the number of shares outstanding.
Capital (Equity) = Share Par Value × Total Shares Issued
Market Capitalization (Company’s Market Value) = Stock Price × Total Shares. After reduction, shareholders hold fewer shares, but as total shares drop, the stock price typically rises, keeping the overall value of holdings (market cap) stable.
Shareholders’ Equity = Capital + Capital Surplus + Retained Earnings. Reducing capital lowers book equity, adjusting the balance sheet.
Why Reduce Capital?
Companies pursue reduction for varied reasons:
- Returning excess cash to shareholders when expansion plans are limited.
- Wiping out accumulated losses to clean up financials.
- Boosting a stock price perceived as undervalued to restore market confidence.
For example, a company with $100 million in capital and 10 million shares (par value $10) might reduce capital by 20%, lowering it to $800 million and shares to 8 million. This shift can trigger diverse financial and market reactions.
2. Three Types of Capital Reduction
Capital reduction comes in three main forms, each with distinct goals and methods:
Type 1: Cash Reduction
Cash reduction involves returning surplus cash to shareholders while cutting capital. Common among cash-rich firms with no immediate growth plans, it can also help major shareholders withdraw funds while avoiding high dividend taxes.
For instance, a company with $100 million in capital reducing by 30% returns $300 million to shareholders, lowering capital to $700 million. This often boosts earnings per share (EPS), making the firm appear more profitable.
In some markets, this method is popular because returned capital isn’t taxed as dividends, offering shareholders a tax advantage. However, it may signal limited growth ambition, requiring investors to weigh long-term value against short-term gains.
Type 2: Loss Offset Reduction
When a company faces persistent losses, accumulated deficits can drag down net asset value per share, risking delisting or restricted trading. Loss offset reduction cancels shares to erase deficits without cash payouts.
For example, a firm with $1000 million in capital and $500 million in losses might reduce capital by 50%, bringing it to $500 million and clearing the deficit. This lifts net asset value per share and may turn EPS positive, enhancing financial optics.
After the capital reduction, the company's net value per share will increase, the financial statements will look more sound, and the EPS may turn from negative to positive, which will help restore market confidence in the short term.
However, such financial improvements are only bookkeeping operations. If the company's business model is not improved at the same time, financial pressure will return. Investors should observe whether there is a real operational turnaround behind the capital reduction, rather than just whitewashing the financial statements.
Type 3: Treasury Stock Reduction
To counter undervaluation or fend off takeovers, companies may buy back shares and cancel them, reducing outstanding shares. This boosts EPS and return on equity (ROE) by concentrating ownership.
For example, a firm repurchasing 10% of its 10 million shares at $30 each spends $30 million, leaving 9 million shares. This doesn’t directly adjust shareholder holdings but can lift stock metrics.
The premise of such operations is that the company itself must have sufficient cash, otherwise it may increase financial pressure.
On the other hand, if the market has no confidence in the company's fundamentals, the effect of the repurchase action may be limited, and it may even be regarded as "saving face" or "wasting resources".
The timing of the repurchase and the company's future operating direction will determine whether such capital reduction can bring substantial benefits.
Comparison of Types
| Type | Purpose | Method | Stock Price Impact | Shares Outstanding | Shareholders’ Equity | Capital | Net Asset Value per Share |
|---|---|---|---|---|---|---|---|
| Cash Reduction | Return excess cash | Distribute cash, reduce capital | Usually rises | Decreases | Decreases | Decreases | Increases |
| Loss Offset Reduction | Clear deficits | Cancel shares, no cash | Usually rises | Decreases | Decreases | Decreases | Increases |
| Treasury Stock Reduction | Boost EPS/ROE, deter takeovers | Repurchase and cancel shares | Varies | Decreases | Decreases | Decreases | Varies |
3. The Capital Reduction Process
While specifics vary by region (e.g., Taiwan and Japan require creditor objection periods, while U.S. firms often use buybacks), the process generally follows these steps:
- Step 1: Board proposes reduction plan.
- Step 2: Shareholders approve via meeting.
- Step 3: Notify creditors, allow objection period.
- Step 4: Execute reduction (e.g., cash payout, share cancellation).
- Step 5: Finalize registration or filings.
The process spans weeks to months, with stock prices often swaying on news and sentiment. The announcement phase offers a window to gauge company strategy and market response.
4. Impact on Companies and Investors
On Company Financials
Reduction shrinks capital, boosting EPS, ROE, and net asset value per share. For instance, a firm with $100 million in profit sees EPS rise from $1 to $1.25 if capital drops from $1000 million to $800 million, polishing financials.
However, cash reductions deplete liquidity, potentially forcing future borrowing and raising risk. Loss offset reductions don’t affect cash but may mask deeper issues if operations lag.
On Shareholders
Shareholders hold fewer shares, but their total investment value typically holds steady. For example, owning 1,000 shares at $50 pre-reduction (value $50,000) becomes 800 shares at $60 post-20% reduction, plus $2,000 cash, maintaining $50,000.
Cash reductions offer tax-free returns in some regions, unlike dividends. Treasury reductions enhance per-share metrics, potentially lifting long-term value.
On Stock Price
Short-term, reductions often spark 5–10% price gains, seen as positive signals. Long-term, success depends on fundamentals and strategy. Cosmetic reductions without operational fixes may lead to fleeting rallies, leaving investors exposed if chasing highs.
5. Pros and Cons of Capital Reduction
Pros
- Enhances EPS, ROE, and net asset value per share, improving financial appeal.
- Cash reductions return capital tax-free in some markets, maximizing shareholder value.
- Treasury reductions can signal undervaluation, boosting confidence and deterring takeovers.
Cons
- Cash reductions cut liquidity, limiting future investments or flexibility.
- Loss offset reductions may only mask issues, failing to address core weaknesses.
- Smaller capital bases can amplify price swings, especially if growth stalls.
6. Calculating Stock Price Post-Reduction
Reduction alters share counts and may involve cash payouts, prompting market adjustments to preserve company value. Below are formulas and examples for each type:
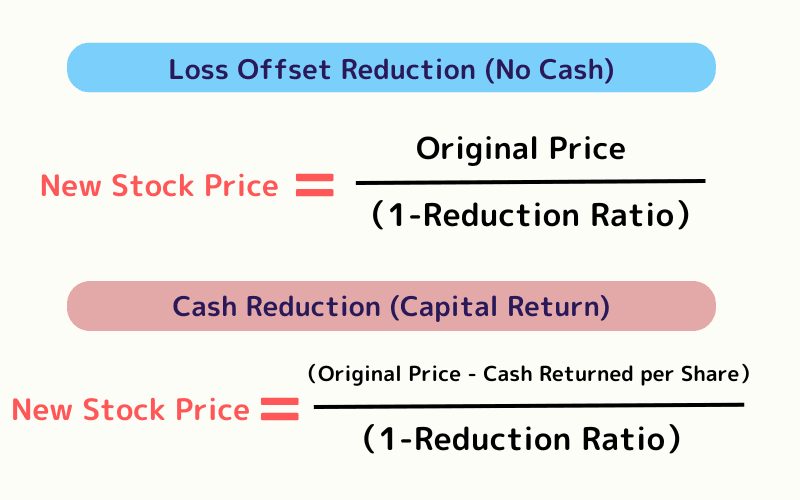
Loss Offset Reduction (No Cash)
Formula:
New Stock Price = Original Price ÷ (1 - Reduction Ratio)
Example:
- Original price $50, 20% reduction: New Price = 50 ÷ (1 - 0.2) = $62.50.
- Holding 1,000 shares becomes 800, value remains $50,000.
Cash Reduction (Capital Return)
Formula:
New Stock Price = (Original Price - Cash Returned per Share) ÷ (1 - Reduction Ratio)
Example:
- Original price $50, 20% reduction, $2 cash per share: New Price = (50 - 2) ÷ (1 - 0.2) = $60.
- 1,000 shares become 800 at $60, plus $2,000 cash, value stays $50,000.
Treasury Stock Reduction
No direct price formula applies, as buybacks use company funds without impacting shareholder stakes. Reduced shares boost EPS and ROE, potentially lifting prices if sentiment improves.
7. Case Study: Yageo’s Reduction Success
Yageo, a Taiwanese electronics firm, is a capital reduction standout. In the 2010s, the passive components sector slumped, dragging Yageo’s stock below $5. Facing losses, it pursued multiple reductions, including loss offsets to clear deficits and cash returns to streamline capital.
In 2018, a 40% reduction cut capital from $300 million to $180 million, flipping EPS positive. Coupled with a sector rebound and price hikes, Yageo’s stock soared from $5 to over $40, cementing its “reduction rocket” status.
Success wasn’t just accounting—Yageo rode market recovery and operational gains. This shows reduction works best with strong fundamentals, not as a standalone fix.
8. Capital Reduction FAQs
Q1. Will my number of shares fall after a capital reduction?
Yes. Shares are cancelled proportionally, so your share count drops by the same ratio — but book value per share and the price adjust, so total value is unchanged in theory. See §6.
Q2. Is a capital reduction bullish or bearish?
It depends. A nominal reduction to offset losses often signals stress, while a real reduction returning cash can be shareholder-friendly. Judge by the motive and fundamentals. See §4.
Q3. How does the share price move after a reduction?
After the ex-rights adjustment the price is revised upward in proportion to the reduction (fewer shares, higher per-share price); what follows depends on how the market views the company's outlook. See §6.
Q4. Is a capital reduction the same as a reverse stock split?
Not exactly. Both cut share count and lift the per-share price, but a capital reduction involves a real change in paid-in capital, whereas a reverse split only re-divides shares.
Q5. What should a retail investor do when a company announces a reduction?
First identify the type and purpose, then check earnings and cash flow — rather than panicking or piling in just because of the word 'reduction'. See §4.
9. Conclusion
Capital reduction isn’t inherently good or bad—it’s a neutral tool. It can polish financials, boost per-share metrics, and return cash, but may also flag stagnation or distress.
Rather than fixating on reduction size, investors should probe motives, execution, and growth plans. Does cash reduction signal weak expansion? Is loss offset just cosmetic? Do buybacks reflect true value? These questions matter.
To navigate reductions, blend financial analysis with industry trends and company strategy. Numbers can shift, but lasting value stems from competitive strength. Stay rational, think long-term, and avoid chasing short-term hype.
Further Reading
Titan FX Trading Strategy Lab. We produce investor-education content covering forex, commodities (crude oil, precious metals, agricultural goods), stock indices, U.S. equities, and digital assets.
Primary Sources (by Category)
- Accounting & rules: Company-law and exchange listing rules governing capital reduction and capital policy
- Titan FX official: What is EPS?, What is Treasury Stock?