

Indicator That Generates Trading Signals Based on “Break & Retest” (Titan_BreakRetest_Signal)
Indicator Overview
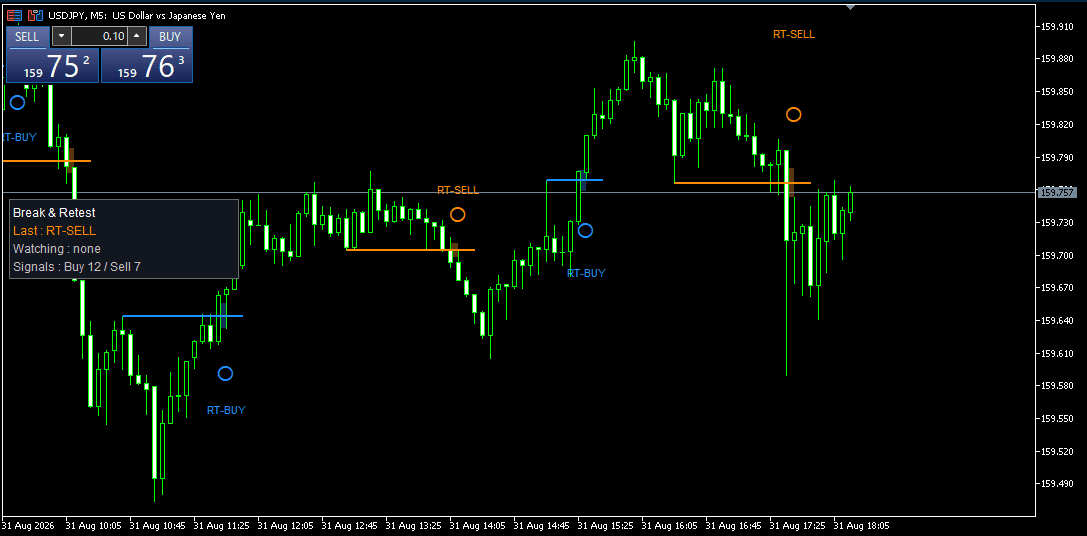
Titan_BreakRetest_Signal is an indicator that generates trading signals based on the classic "Break & Retest" trading strategy.
Breakouts above highs or below lows can be powerful signals, but entering immediately on a breakout is known to carry the risk of a "false breakout," where the price reverses as soon as the breakout occurs. Experienced traders do not enter immediately on a breakout. Instead, they wait for the price to return to the breakout level (retest) and confirm that the level now acts as support (or resistance) before entering a trade. This indicator automatically monitors this "wait, confirm, then enter" process and generates a signal only when all conditions are met.
- Breakout Detection — The closing price of a candlestick clearly breaks above/below a confirmed swing high/low
- Retest Monitoring — After the breakout, waits for the price to return to the breakout level (a zone calculated using ATR) within a specified period
- Signal Confirmation — When the returning price is supported by the zone and a confirmed candle closes again in the breakout direction, an "RT-BUY / RT-SELL" signal is displayed
If the price clearly breaks back through the breakout level during this process, the setup is discarded as a "failed breakout." All signals are determined using confirmed candles only, so they will not disappear or move afterward (no repainting).
How It Works
Swing confirmation uses fractal detection (comparison with several candlesticks on both the left and right), and only confirmed swings are used as breakout reference levels. A retest is considered "supported" only when the price touches the zone and a confirmed candle closes in the breakout direction. The entire detection process is recalculated from historical data using the same procedure each time, so the same signals are displayed at the same locations whenever you open the chart.
Display
・The buy side (upward breakout retest) is shown in DodgerBlue, while the sell side (downward breakout retest) is shown in DarkOrange.
・A set of three elements—the horizontal line used as the breakout reference level, the retest zone (rectangle), and a circular marker + RT-BUY/RT-SELL label at the confirmation point—allows you to see at a glance "which level was tested, how it was tested, and where the setup was confirmed."
・While a setup is in progress, a dotted line + "Waiting for Retest" is displayed in real time. The panel also displays "Monitoring: Waiting for Retest After Upward Breakout," allowing you to prepare before a signal appears.
This indicator is a supplementary tool designed to identify potential entry points. It does not guarantee that the market will move in accordance with its signals.
How to Read This Indicator
- Blue Circle + RT-BUY: Retest confirmed after an upward breakout. A potential entry point for buying on a pullback
- Orange Circle + RT-SELL: Retest confirmed after a downward breakout. A potential entry point for selling on a rally
- Dotted Line + "Waiting for Retest": A breakout has already occurred and the setup is waiting for a retest. Watch for the price to return to this level
- While "Monitoring" on the panel is highlighted in blue/orange, a setup is in progress
- If the line disappears without a signal appearing, it means the setup was skipped due to expiration or a failed breakout
※This indicator works only with Titan FX's Windows versions of MT5 and MT4.
Indicator Terms of Use
Only those who agree to all the following items may use the indicators distributed on this website (https://research.titanfx.com):
1.The indicators and related descriptions are based on various data believed to be reliable, but their accuracy and completeness are not guaranteed.
2.The data displayed by the indicators do not guarantee your investment results. Also, the displayed content may vary due to market conditions and communication environments.
3.Please make investment decisions using indicators at your own risk. We are not responsible for any disadvantages or damages arising from the use of indicators.
4.Specifications of the indicators are subject to change without notice. Changes will be announced on the indicator description pages, etc.
5.Indicators should only be used by customers who have downloaded them. Transferring or selling the indicators to third parties is prohibited.
Indicator Settings
Settings in the Inputs Tab (MT5) / Inputs Tab (MT4)
| Variable Name | Description | Default |
|---|---|---|
| Bars to analyze | Number of historical bars to include in detection | 500 |
| Swing detection bars (each side) | Conditions for confirming swings used as breakout reference levels. Higher values target only larger price swings | 3 |
| Retest window after break (bars) | The setup is skipped if a retest is not confirmed within this number of bars | 20 |
| ATR period for zone width | ATR period used to calculate the retest zone width | 14 |
| Retest zone width (ATR multiple) | Tolerance range above and below the breakout level | 0.25 |
| Max signals shown | Number of most recent signals retained on the chart | 6 |
| Show pending setup | Whether to display the dotted line while waiting for a retest | true |
| Status Panel | Whether to display the status panel in the upper-left corner | true |
| Alert on new signal | Whether to send a notification when a retest is confirmed | false |
| Buy (break-up retest) | Color of lines, zones, and markers | DodgerBlue |
| Sell (break-down retest) | Color of lines, zones, and markers | DarkOrange |
Settings in the Colors Tab (MT5) / Colors Tab (MT4)
This indicator does not use these settings.