
 Home
Home- List of Indicators for MT5/MT4
- Currency Pair Correlation Heatmap Indicator (Titan_CorrelationChecker)
Currency Pair Correlation Heatmap Indicator (Titan_CorrelationChecker)
Indicator Overview
Correlation Checker for Viewing Currency Pair Relationships in a Heatmap
This indicator is an analysis tool that calculates how similarly multiple currency pairs move using correlation coefficients and displays the results in a heatmap-style table.
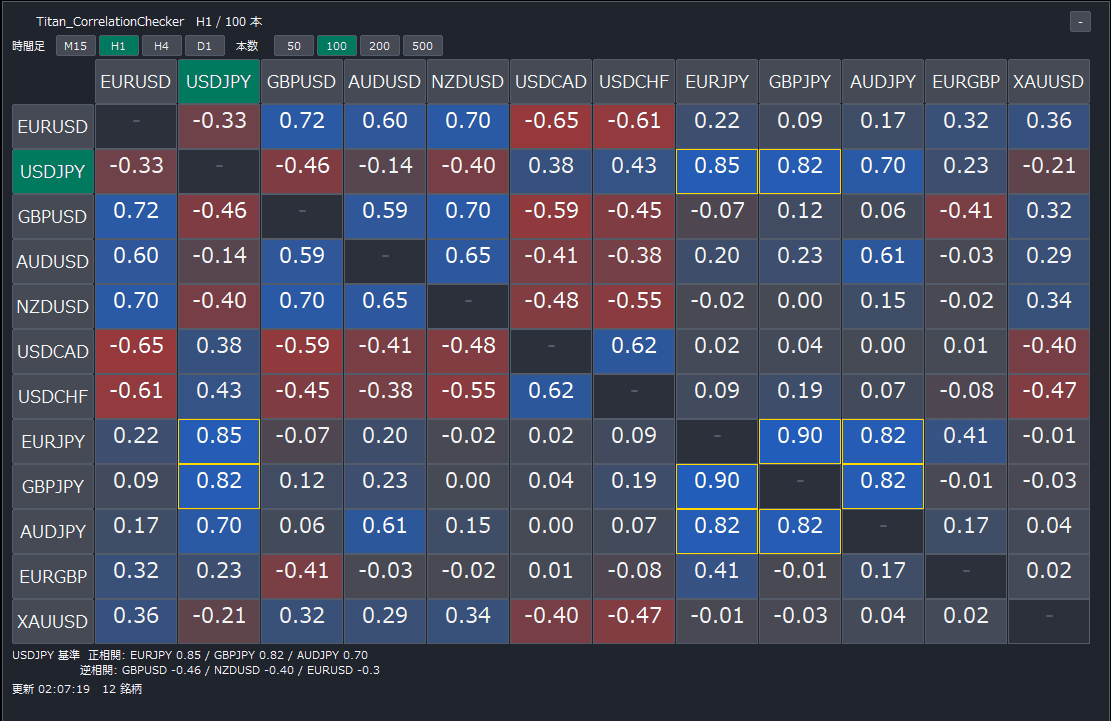
It calculates all possible combinations of up to 20 instruments and color-codes pairs that tend to move in the same direction in blue and pairs that tend to move in opposite directions in red.
The darker the color, the stronger the relationship, while colors closer to gray indicate a weaker relationship.
A correlation coefficient closer to +1.00 indicates that "the two pairs move almost identically," while a value closer to -1.00 indicates that "they move in exactly opposite directions." A value around 0.00 indicates that "there is little relationship between their movements."
Combinations with an absolute correlation coefficient of 0.8 or higher are highlighted with a gold border, allowing you to quickly identify pairs with a strong relationship.
This allows you to use the tool to check whether your risk is overly concentrated by holding simultaneous positions in pairs that tend to move in the same direction, or to look for instruments that may help diversify your positions.
You can also switch the timeframe and number of bars used for calculations directly from the buttons on the panel, and rankings of pairs with strong and weak correlations to the currently displayed instrument are shown below the table.
Clicking a row or column header also allows you to switch the chart instrument to that instrument.
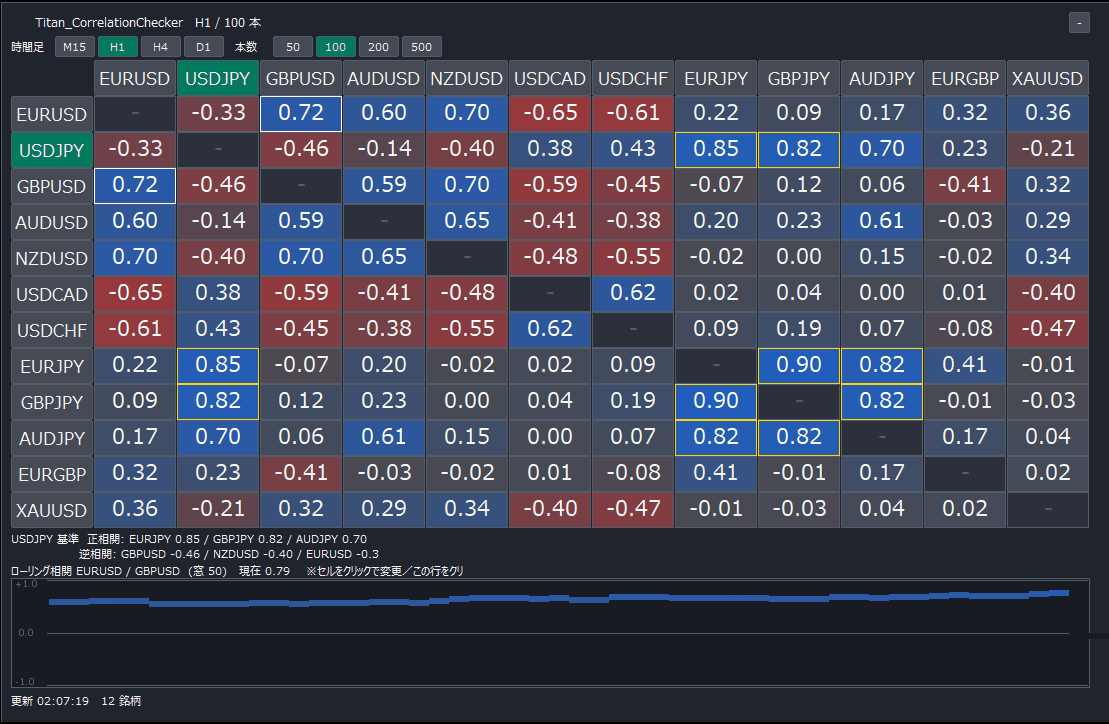
In addition, clicking a cell in the table displays the "rolling correlation" between the two instruments (how the correlation coefficient has changed over time) in a graph below the table.
Because correlation is not always constant and may strengthen or weaken over time, you can use this feature to check whether the current correlation has remained stable or is only temporary.
*Correlation coefficients are statistical values calculated from historical price movements and do not indicate future price movements.
[Example of correlation calculated using H1 and 100 bars]
[Example of displaying rolling correlation by clicking a cell]
How to Use
① Open one chart for displaying the correlation table and apply this indicator. By default, the correlation table is displayed using the entire chart window, so we recommend preparing a dedicated chart for it.
② The correlation coefficient between the two instruments is displayed in the cell where the corresponding row and column intersect. The darker the blue, the more likely the pair is to move in the same direction; the darker the red, the more likely the pair is to move in opposite directions.
③ Press the timeframe buttons or bar count buttons at the top of the panel to switch the timeframe and number of candlesticks used for calculations and immediately recalculate the results.
④ Below the table, rankings of positive and negative correlations are displayed based on the instrument currently shown on the chart (indicated by the green header).
⑤ Clicking a row or column header switches the chart instrument to that instrument and also changes the reference instrument used for the rankings.
⑥ Clicking a cell in the table displays the rolling correlation between the two instruments below the table. The currently selected cell is indicated by a white border, and clicking another cell switches the selected pair. Click the same cell again or click the rolling correlation header row to close it.
The rolling correlation graph displays reference lines at +1.0, 0.0, and -1.0, allowing you to review changes in correlation over time. The number of displayed points is calculated as "Number of Bars for Calculation - Correlation Window Size + 1." With the default settings (100 bars and a window size of 50), 51 points are displayed. If you want to view changes over a longer period, increase the number of bars using the bar count buttons.
The instruments used for calculation can be changed with the "Target Instruments" parameter. Immediately after startup, or when historical data has not yet been loaded for an instrument, "..." or "N/A" is displayed. The indicator automatically recalculates once the historical data has been retrieved.
*If instruments with trading hours different from FX, such as US stock CFDs or cryptocurrencies, are included, calculations are performed only for periods where candlesticks exist at the same timestamps, making "N/A" more likely to appear. When including US stock CFDs, set the timeframe to H1 or higher (D1 is recommended). When including cryptocurrencies, set the number of bars for calculation to 200 or more.
*This indicator works only with the Windows versions of MT5 and MT4 provided by Titan FX.
Indicator Terms of Use
Only those who agree to all the following items may use the indicators distributed on this website (https://research.titanfx.com):
1.The indicators and related descriptions are based on various data believed to be reliable, but their accuracy and completeness are not guaranteed.
2.The data displayed by the indicators do not guarantee your investment results. Also, the displayed content may vary due to market conditions and communication environments.
3.Please make investment decisions using indicators at your own risk. We are not responsible for any disadvantages or damages arising from the use of indicators.
4.Specifications of the indicators are subject to change without notice. Changes will be announced on the indicator description pages, etc.
5.Indicators should only be used by customers who have downloaded them. Transferring or selling the indicators to third parties is prohibited.
Indicator Settings
Settings in the Inputs Tab (MT5) or Parameters Tab (MT4)
| Parameter | Description | Default |
|---|---|---|
| Symbol source | Sets how the symbols to calculate are obtained: "Manual list" or "Market Watch". | Manual list |
| Symbols (comma separated) | Sets the target symbols, separated by commas, when Symbol source is set to Manual list. | EURUSD,USDJPY,GBPUSD, AUDUSD,NZDUSD,USDCAD, USDCHF,EURJPY,GBPJPY, AUDJPY,EURGBP,XAUUSD |
| Symbol suffix (blank = auto detect) | Sets the characters appended to symbol names on your account (e.g. .raw). If left blank, it is detected automatically. | (blank) |
| Max symbols (up to 20) | Sets the maximum number of symbols to display. | 20 |
| Timeframe for calculation | Sets the timeframe used for the calculation at startup. It can also be changed with the buttons on the panel. | H1 |
| Number of bars N | Sets the number of bars used for the calculation (20 to 998). | 100 |
| Return calculation | Sets the values used for the calculation: "Log return", "Price difference" or "Close price". | Log return |
| Minimum samples (below this shows N/A) | Pairs with fewer usable bars than this value are shown as N/A. | 80 |
| Update trigger | Sets when the correlation is recalculated: "On new bar" or "Fixed interval". | On new bar |
| Update interval (seconds) | Sets the update interval when Update trigger is set to Fixed interval. | 30 |
| Pairs calculated per cycle | Sets the number of pairs calculated in one cycle. A smaller value reduces the load but slows down updates. | 30 |
| Language | Sets the language displayed on the panel. | English |
| Full screen mode | If set to true, the table uses the entire chart area. Cell and text sizes are adjusted automatically to fit the window. | true |
| Hide price chart in full screen | If set to true, candlesticks and other chart elements are hidden in full screen mode, making the chart dedicated to the correlation table. | true |
| Panel corner (ignored in full screen) | Sets the chart corner used as the reference for the panel position. | Upper left |
| Panel X (px) | Sets the horizontal distance from the reference corner to the panel. | 10 |
| Panel Y (px) | Sets the vertical distance from the reference corner to the panel. | 20 |
| Cell width (px) | Sets the width of the table cells (ignored in full screen mode). | 52 |
| Cell height (px) | Sets the height of the table cells (ignored in full screen mode). | 18 |
| Header column width (px) | Sets the width of the table header column (ignored in full screen mode). | 64 |
| Font | Sets the font of the text displayed on the panel. | Meiryo UI |
| Font size | Sets the size of the text displayed on the panel. | 8 |
| Color scheme | Sets the color scheme of the heat map: "Blue - Red" or "Blue - Orange (color blind safe)". | Blue - Red |
| Panel background color | Sets the background color of the panel. | 32,36,44 |
| Color for zero correlation | Sets the color of cells whose correlation coefficient is around 0. | 70,74,84 |
| Text color | Sets the color of the text displayed on the panel. | WhiteSmoke |
| Border color | Sets the color of the panel and cell borders. | 84,92,106 |
| Highlight frame color | Sets the color of the frame that highlights strongly correlated cells. | Gold |
| Highlight threshold of |correlation| | Cells whose absolute correlation is at or above this value are highlighted with a frame. | 0.8 |
| Show ranking rows | Sets whether to show the ranking of pairs with the strongest positive and negative correlation to the current symbol. | true |
| Number of ranking entries | Sets the number of entries shown in the ranking. | 3 |
| Click header to switch chart symbol | If set to true, clicking a row or column header switches the chart symbol. | true |
| Start minimized | If set to true, the panel starts in the collapsed state. | false |
| Show rolling correlation | If set to true, the rolling correlation is displayed from startup. Even if set to false, it can be displayed by clicking a cell in the table. | false |
| Pair A (blank = chart symbol) | Sets the first symbol of the rolling correlation displayed at startup. If left blank, the chart symbol is used. It can be changed by clicking a cell in the table. | (blank) |
| Pair B (blank = first in list) | Sets the second symbol of the rolling correlation displayed at startup. If left blank, the first symbol in the Symbols list is used. It can be changed by clicking a cell in the table. | (blank) |
| Rolling window size | Sets the number of bars used to calculate the correlation at each point of the rolling correlation. | 50 |
| Rolling correlation height (px) | Sets the height of the rolling correlation graph (40 to 400). The width is adjusted automatically to match the table. | 110 |
Settings in the Colors Tab (MT5) or Color Settings Tab (MT4)
This indicator does not use this tab.