

Automatically Detect Divergences and Measure Their Strength(Titan_Divergence_Sniper)
Indicator Overview
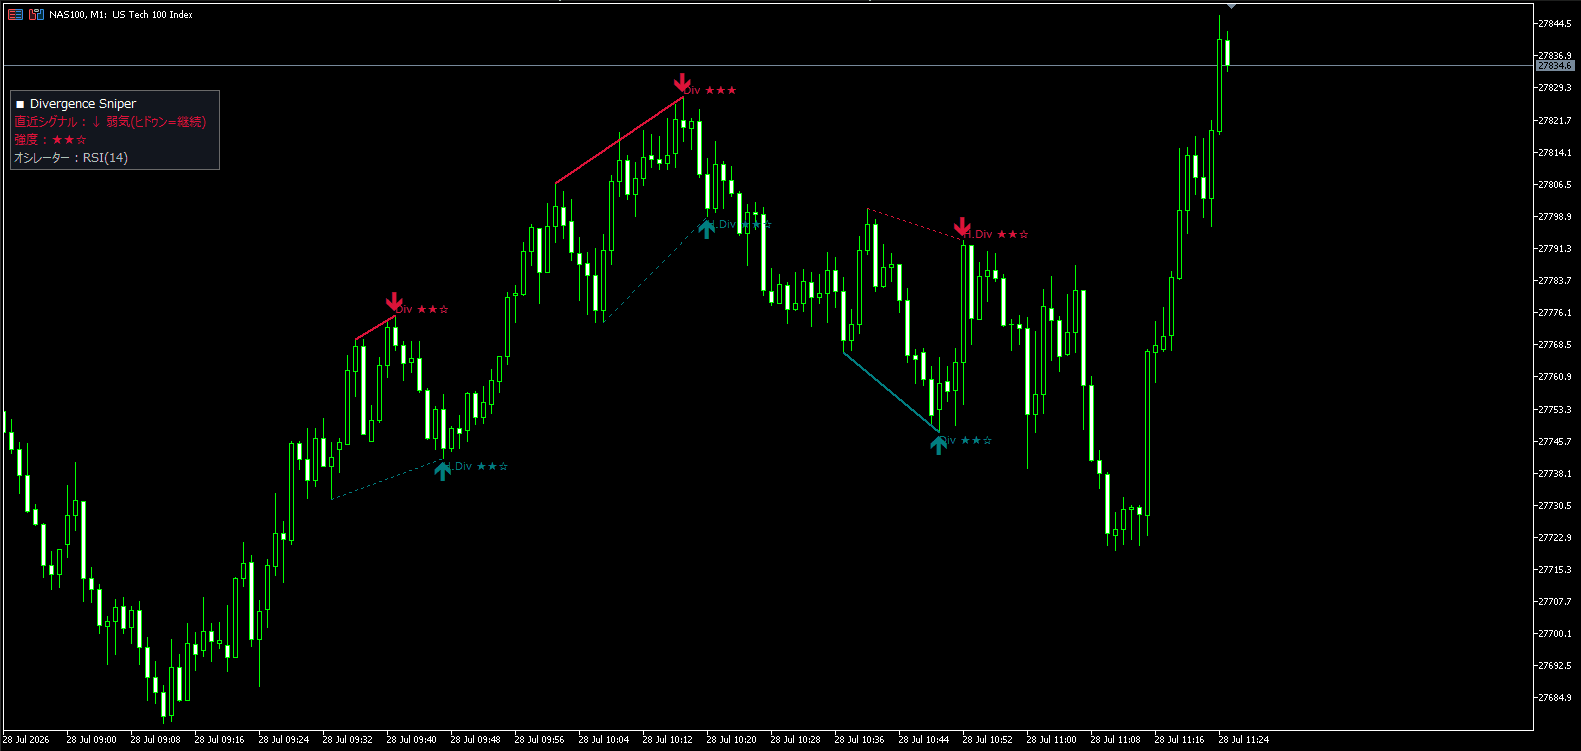
Titan Divergence Sniper is a tool that automatically detects divergences—discrepancies between price and an oscillator (RSI or MACD)—and displays them on the chart using connecting lines, arrows, and strength ratings (★1–3).
A divergence is a discrepancy between price and momentum, such as when “price makes a higher high, but the RSI peak is lower than the previous one.” This is considered a sign that market momentum is weakening and is used by traders worldwide as a leading signal of a potential reversal or loss of momentum. However, identifying divergences visually requires comparing two peaks or troughs, making them easy to overlook or misinterpret. This indicator automates the entire comparison process.
The indicator can detect the following two types, which are further divided into four bullish and bearish patterns.
-
① Regular Divergence = A warning sign of a potential reversal (price makes a new high or low, but momentum fails to follow)
-
② Hidden Divergence = A sign of trend continuation (momentum alone moves excessively during a pullback or retracement)
Each signal is also assigned a strength rating (★1–3). More stars are awarded when conditions associated with greater effectiveness are met, such as when the oscillator is in overbought or oversold territory or when the spacing between the two swings is ideal.
Illustration of the Four Patterns
In each illustration, the upper section shows the “price” movement, and the lower section shows the “oscillator” movement.
① Regular Bearish Divergence (Reversal Warning: Uptrend → Downtrend)
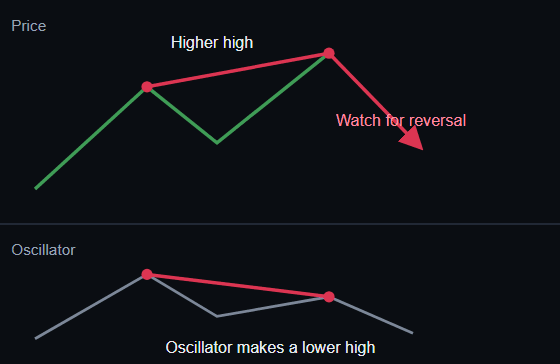
Although price makes a higher high, the oscillator peak is lower than the previous one. This signals that upward momentum is weakening internally, indicating caution against a potential downward reversal from the top.
② Regular Bullish Divergence (Potential Reversal: Downtrend → Uptrend)
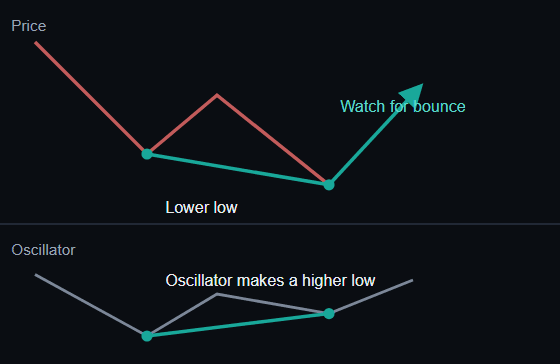
Although price makes a lower low, the oscillator trough is higher than the previous one. This signals that downward momentum may be nearing exhaustion, indicating a potential upward rebound from the bottom.
③ Hidden Bearish Divergence (Downtrend Continuation)
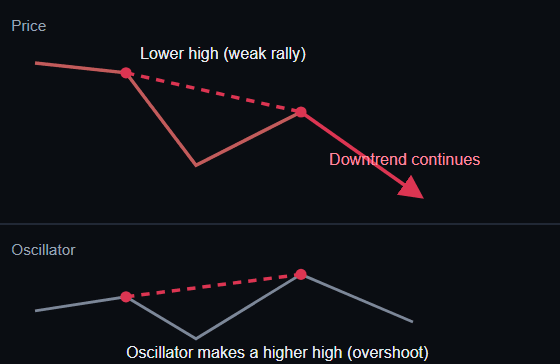
This occurs during a retracement within a downtrend. Although the price high is lower than the previous high, the oscillator alone rises above its previous peak, indicating that the retracement has gone too far. This may serve as a reference point for selling the rally and suggests that the downtrend may continue.
④ Hidden Bullish Divergence (Uptrend Continuation)
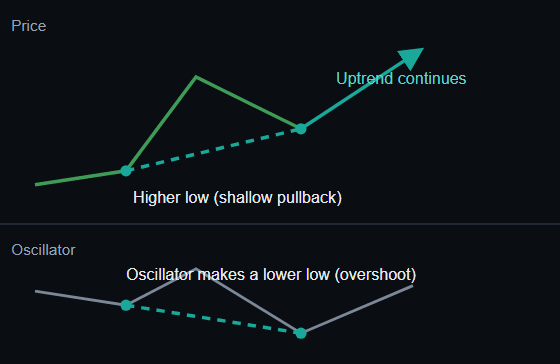
This occurs during a pullback within an uptrend. Although the price low is higher than the previous low, the oscillator alone falls below its previous trough, indicating that the pullback has gone too far. This may serve as a reference point for buying the dip and suggests that the uptrend may continue.
| Type | Price | Oscillator | Meaning | Line Style |
|---|---|---|---|---|
| Regular Bearish | Higher high | Lower high | Warning of a downward reversal | Solid |
| Regular Bullish | Lower low | Higher low | Potential upward rebound | Solid |
| Hidden Bearish | Lower high | Higher high | Downtrend continuation | Dotted |
| Hidden Bullish | Higher low | Lower low | Uptrend continuation | Dotted |
How to Remember: With regular divergence, “price makes a new high or low, but momentum fails to follow” = a reversal signal. With hidden divergence, “price movement is restrained, but momentum alone moves too far” = a continuation signal.
Basic Mechanism
The indicator identifies peaks and troughs (swings) on the chart by comparing them with several candles on both the left and right. It then checks for discrepancies between the “price level” and the “oscillator level” among confirmed peaks and confirmed troughs. Because signals are evaluated only after a swing has been confirmed, a key feature is that once a signal appears, it does not disappear or move later (no repainting).
Display Information
-
Bearish signals (sell caution) are displayed in crimson, while bullish signals (buy caution) are displayed in teal, with lines and arrows connecting the two swings.
-
Regular divergences are drawn with solid lines, while hidden divergences are drawn with dotted lines.
-
Labels display the type and strength (for example,
Div ★★☆orH.Div ★☆☆). -
The panel in the upper-left corner continuously displays the direction, type, and strength of the latest signal. Alert notifications can also be configured.
This indicator is a supplementary tool that identifies potential reversal and continuation “warning points.” Divergence is a widely recognized analytical method with known statistical effectiveness, but it does not guarantee that the market will move in accordance with the signal.
How to Interpret This Indicator
-
Downward arrow + crimson line: Bearish divergence. Upward momentum is weakening, indicating caution against a reversal (regular divergence) or continued decline (hidden divergence).
-
Upward arrow + teal line: Bullish divergence. Downward momentum is weakening, indicating a potential rebound (regular divergence) or continued rise (hidden divergence).
-
Number of stars: The more stars displayed, the more “favorable conditions” are present. A three-star signal occurs in an overbought or oversold zone with ideal spacing between the swings.
-
The “Latest Signal” section in the upper-left panel allows you to see the direction and type of the most recent signal at a glance.
※This indicator works only with the Windows versions of MT5 and MT4 provided by Titan FX.
Indicator Terms of Use
Only those who agree to all the following items may use the indicators distributed on this website (https://research.titanfx.com):
1.The indicators and related descriptions are based on various data believed to be reliable, but their accuracy and completeness are not guaranteed.
2.The data displayed by the indicators do not guarantee your investment results. Also, the displayed content may vary due to market conditions and communication environments.
3.Please make investment decisions using indicators at your own risk. We are not responsible for any disadvantages or damages arising from the use of indicators.
4.Specifications of the indicators are subject to change without notice. Changes will be announced on the indicator description pages, etc.
5.Indicators should only be used by customers who have downloaded them. Transferring or selling the indicators to third parties is prohibited.
Indicator Settings
Settings in the Inputs Tab (MT5) or Parameters Tab (MT4)
| Variable Name | Description | Default |
|---|---|---|
| Bars to analyze | How many past bars to scan for signals | 500 |
| Fractal bars (each side) | Bars on each side used to confirm a swing; larger values pick up only larger waves | 3 |
| Oscillator | RSI or MACD (main line) | RSI |
| RSI period | Calculation period for RSI | 14 |
| MACD fast / slow / signal | Periods used when MACD is selected | 12 / 26 / 9 |
| Min bars between swings | Lower limit to avoid comparing swings that are too close | 5 |
| Max bars between swings | Upper limit to avoid comparing swings that are too far apart | 60 |
| Show hidden divergences | Whether to include continuation-type (hidden) detection | true |
| Max items (recent first) | Number of recent signals kept on the chart | 6 |
| Summary panel | Show/hide the info panel in the upper left | true |
| Alert on new detection | Notify when a new signal is confirmed | false |
| RSI overbought level | Threshold used for the star rating | 65 |
| RSI oversold level | Threshold used for the star rating | 35 |
| Bearish divergence | Line, arrow, and label color for sell-side signals | Crimson |
| Bullish divergence | Line, arrow, and label color for buy-side signals | Teal |
Settings in the Colors Tab (MT5) or Color Settings Tab (MT4)
This indicator does not use this tab.